DeFi lending rates look simple on the surface. A protocol shows you a number, you deposit, and the number becomes your yield. But that number is not set by a bank committee or a customer service tier. It is set by an algorithm that reprices every time someone borrows or repays, and it moves with forces that have nothing to do with the protocol itself: Federal Reserve policy, stablecoin demand, token incentive schedules, and how much leverage traders want this month. If you deposit without understanding what actually sets the rate, you will be surprised twice — once when your 9% becomes 4%, and once when you learn that was normal.
This guide explains how DeFi lending rates are computed, what the real numbers look like across on-chain and centralized venues, which macro forces move them, and how to compare rates honestly before you commit funds. Everything here is compiled from published protocol documentation, on-chain market data, and dated research reports — sources are listed at the end.
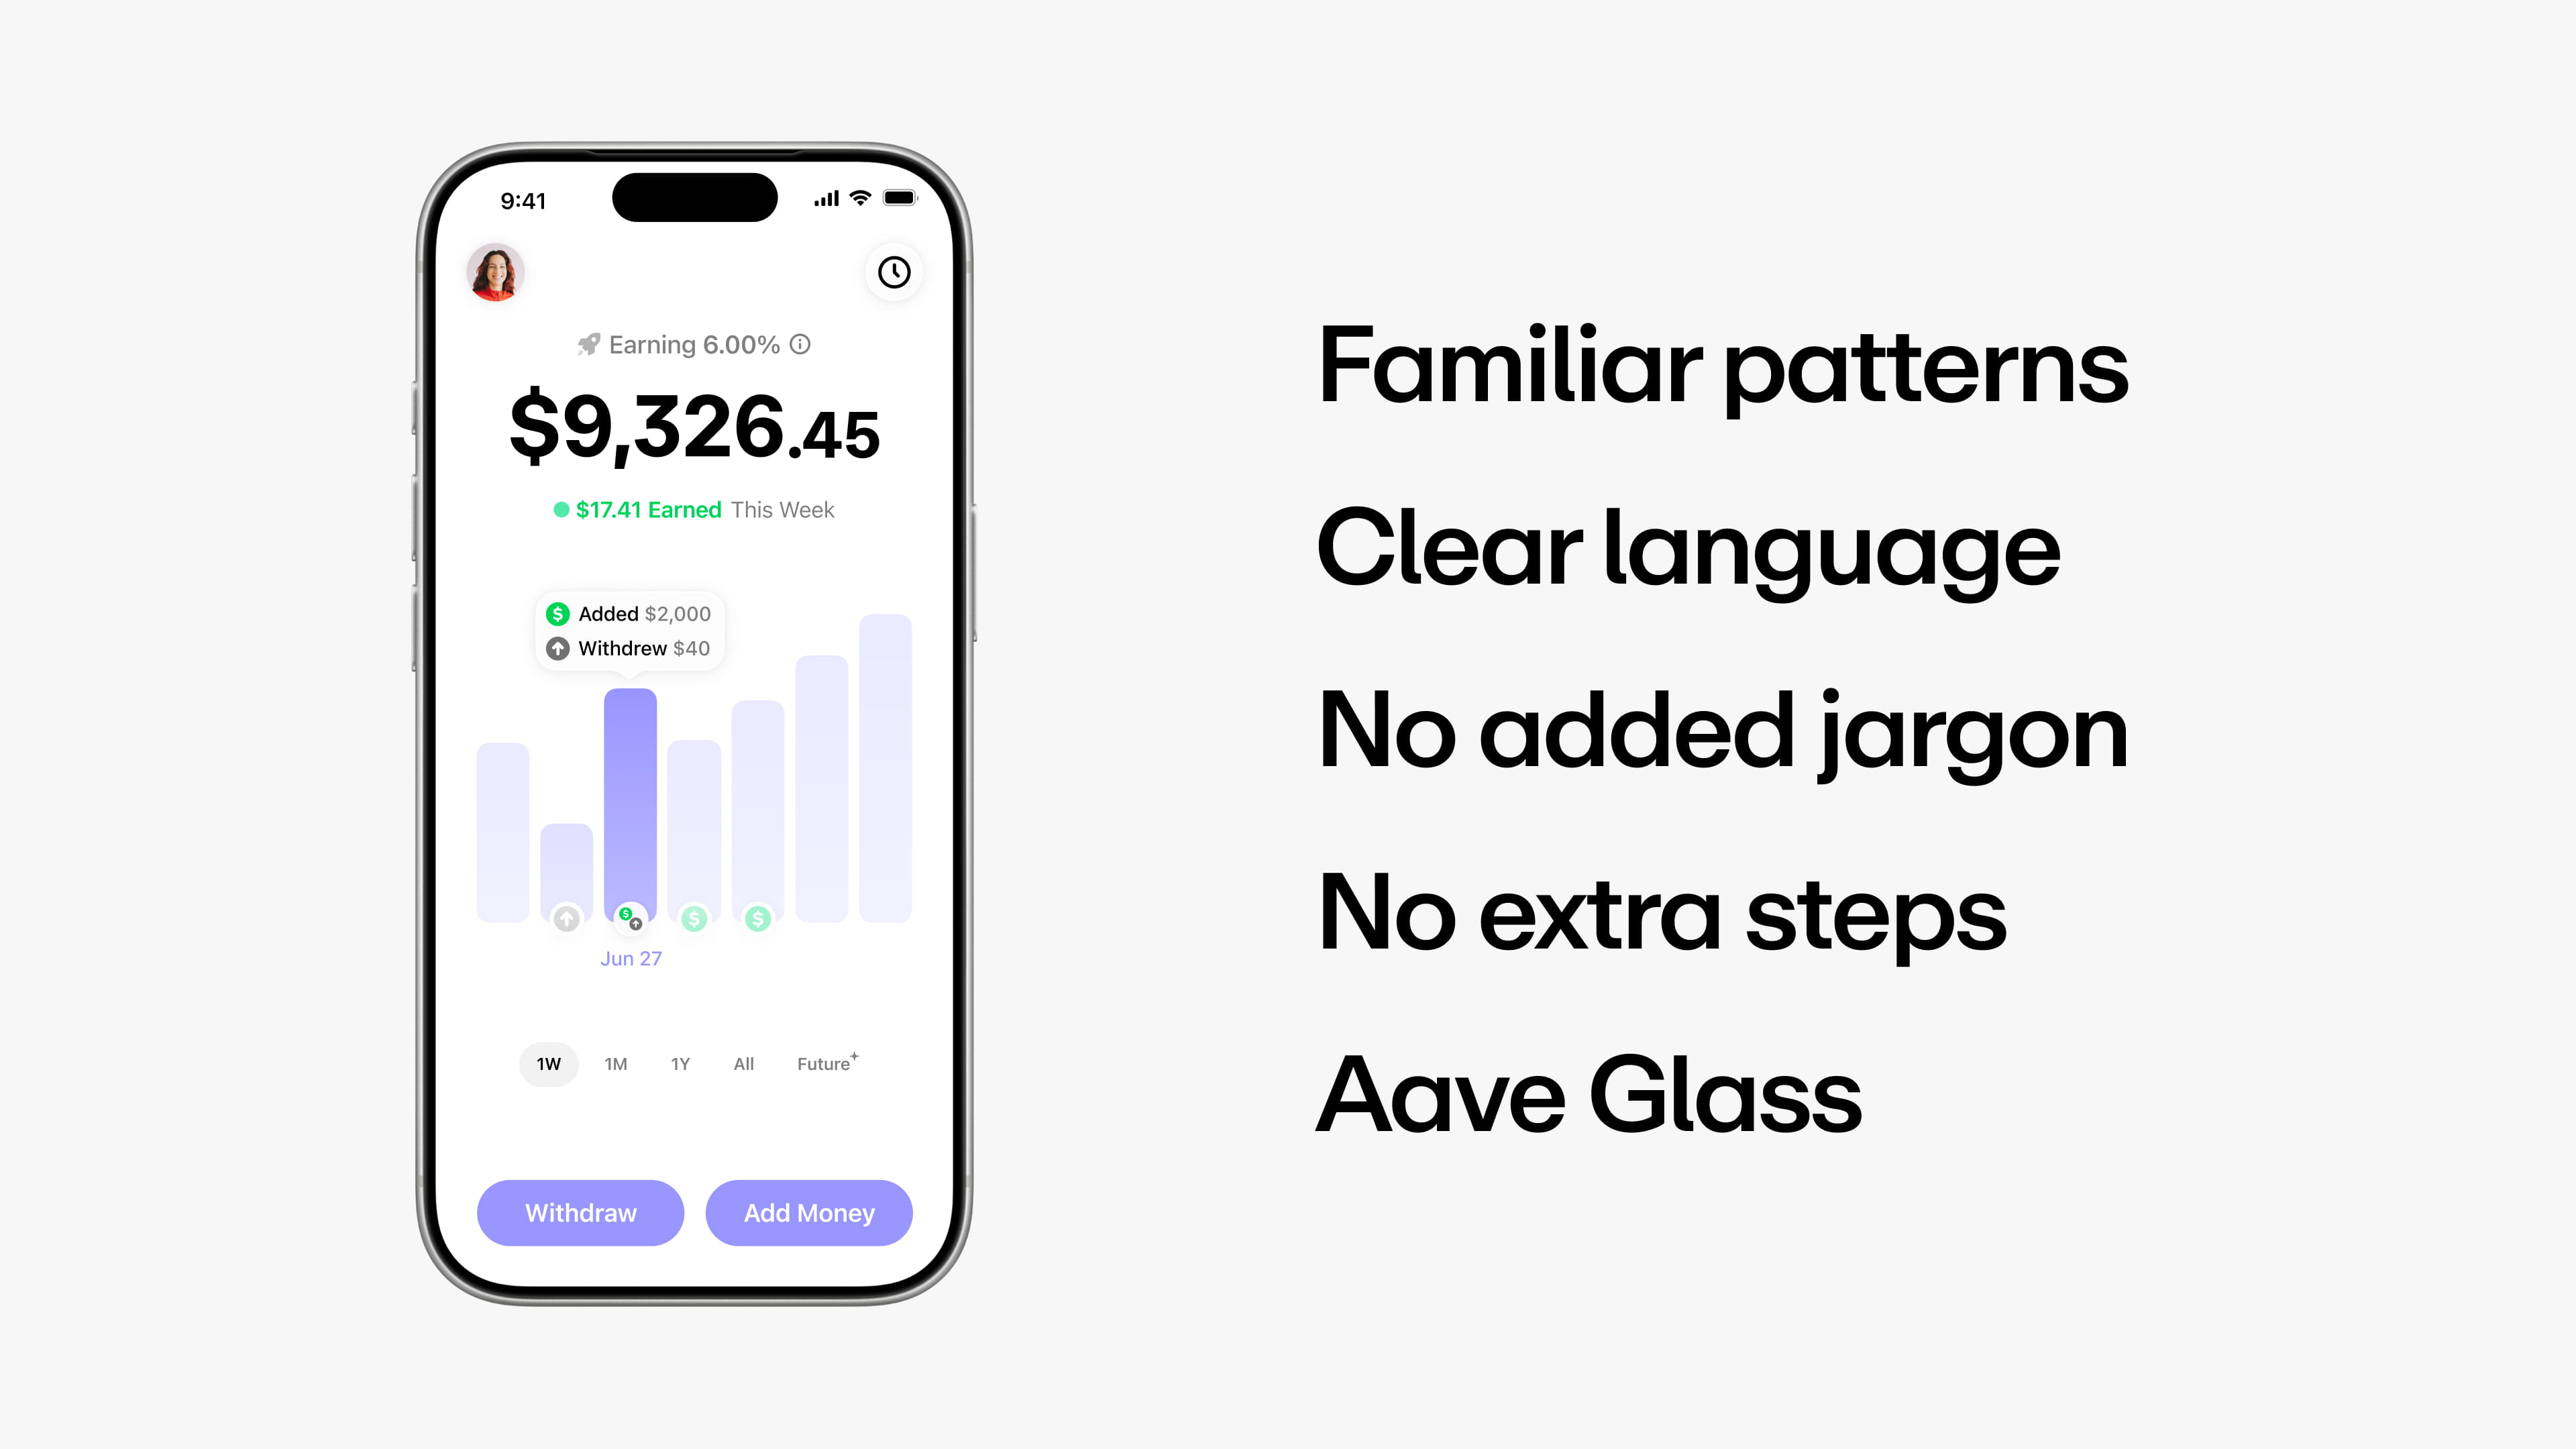
Image: Aave — the Aave app savings interface, showing a 6.00% APY on a stablecoin balance. The headline number is variable and reprices continuously with market utilization.
Quick solution
If you just want the practical answer: on-chain stablecoin lending rates on major protocols have generally sat in the 4–6% range for supply-side depositors in recent cycles, while borrowing against crypto on the same venues has cost roughly 4–6% — versus 8–12% at centralized crypto lenders and 10–15% or more for unsecured personal loans, per Aave's September 2025 crypto-backed loans report. Check the utilization rate before you deposit (above roughly 90% means the rate is spiking and may crash back down), treat any APY far above the market band as incentive-driven and temporary, and compare the seven-day or thirty-day average rate rather than the instant number. Our platform comparison guide covers which venues publish those averages.
Nearly every major lending protocol — Aave, Compound, Morpho's underlying markets, Spark — prices interest with a utilization curve. Utilization is the share of the deposited pool that is currently lent out. If depositors have supplied 100 million USDC and borrowers have taken 80 million, utilization is 80%.
The curve works in two regimes:
Below a target point (often around 90% utilization), the borrow rate climbs slowly. The protocol wants to encourage borrowing, so money stays cheap while there is plenty of idle supply. Above the target — the "kink" — the rate climbs steeply. This is a deliberate emergency brake. High utilization means depositors who want to withdraw might not be able to, because their funds are lent out. A steep rate spike pays borrowers to repay and depositors to add funds, pulling the pool back toward balance.
Your supply APY is derived from the borrow rate: it is roughly the borrow rate multiplied by utilization, minus the protocol's reserve cut. That is why supply and borrow rates move together, and why a supply rate can never exceed the borrow rate that funds it.
Three practical consequences follow. First, rates reprice block by block — the number you see is an instantaneous snapshot, not a promise. Second, a rate spike is information: it tells you the pool is nearly drained, which matters if you may need to exit quickly. Third, no one can "set" a fake rate on these systems without real borrowing demand behind it, which is a structural honesty advantage over centralized lenders that quote whatever marketing wants. We cover that contrast in depth in DeFi versus CeFi lending.
What the numbers actually look like
Scale matters when judging whether quoted rates reflect a real market. Aave — the largest on-chain lending protocol — reported crossing $3 trillion in cumulative deposits and $850 billion in cumulative loans by September 2025, with roughly $70 billion in net deposits and about 60% of on-chain lending market share at the time. By the close of 2025, Aave's own year-end recap put its deposits at $55 billion, up 57% for the year, representing 61% of all active on-chain loans ($23.5 billion of the sector's $38.4 billion). Rates formed on that much volume are market prices, not promotional numbers.
The table below compiles the rate bands reported in Aave's September 2025 crypto-backed loans analysis, alongside the venue characteristics that explain the gaps. These are typical bands, not guarantees — every figure is variable.
| Venue type | Typical stablecoin borrow cost | What backs the rate | Rate transparency |
|---|---|---|---|
| On-chain lending protocols (Aave, Morpho, Compound) | ~4–6% | Overcollateralized crypto, liquidated automatically | Utilization curve, visible on-chain in real time |
| Centralized crypto lenders | ~8–12% | Custodied collateral, manual margin calls | Quoted by the company, changeable at will |
| Unsecured personal loans (banks, fintech) | ~10–15%+ | Credit score and income | Fixed at origination, opaque pricing model |
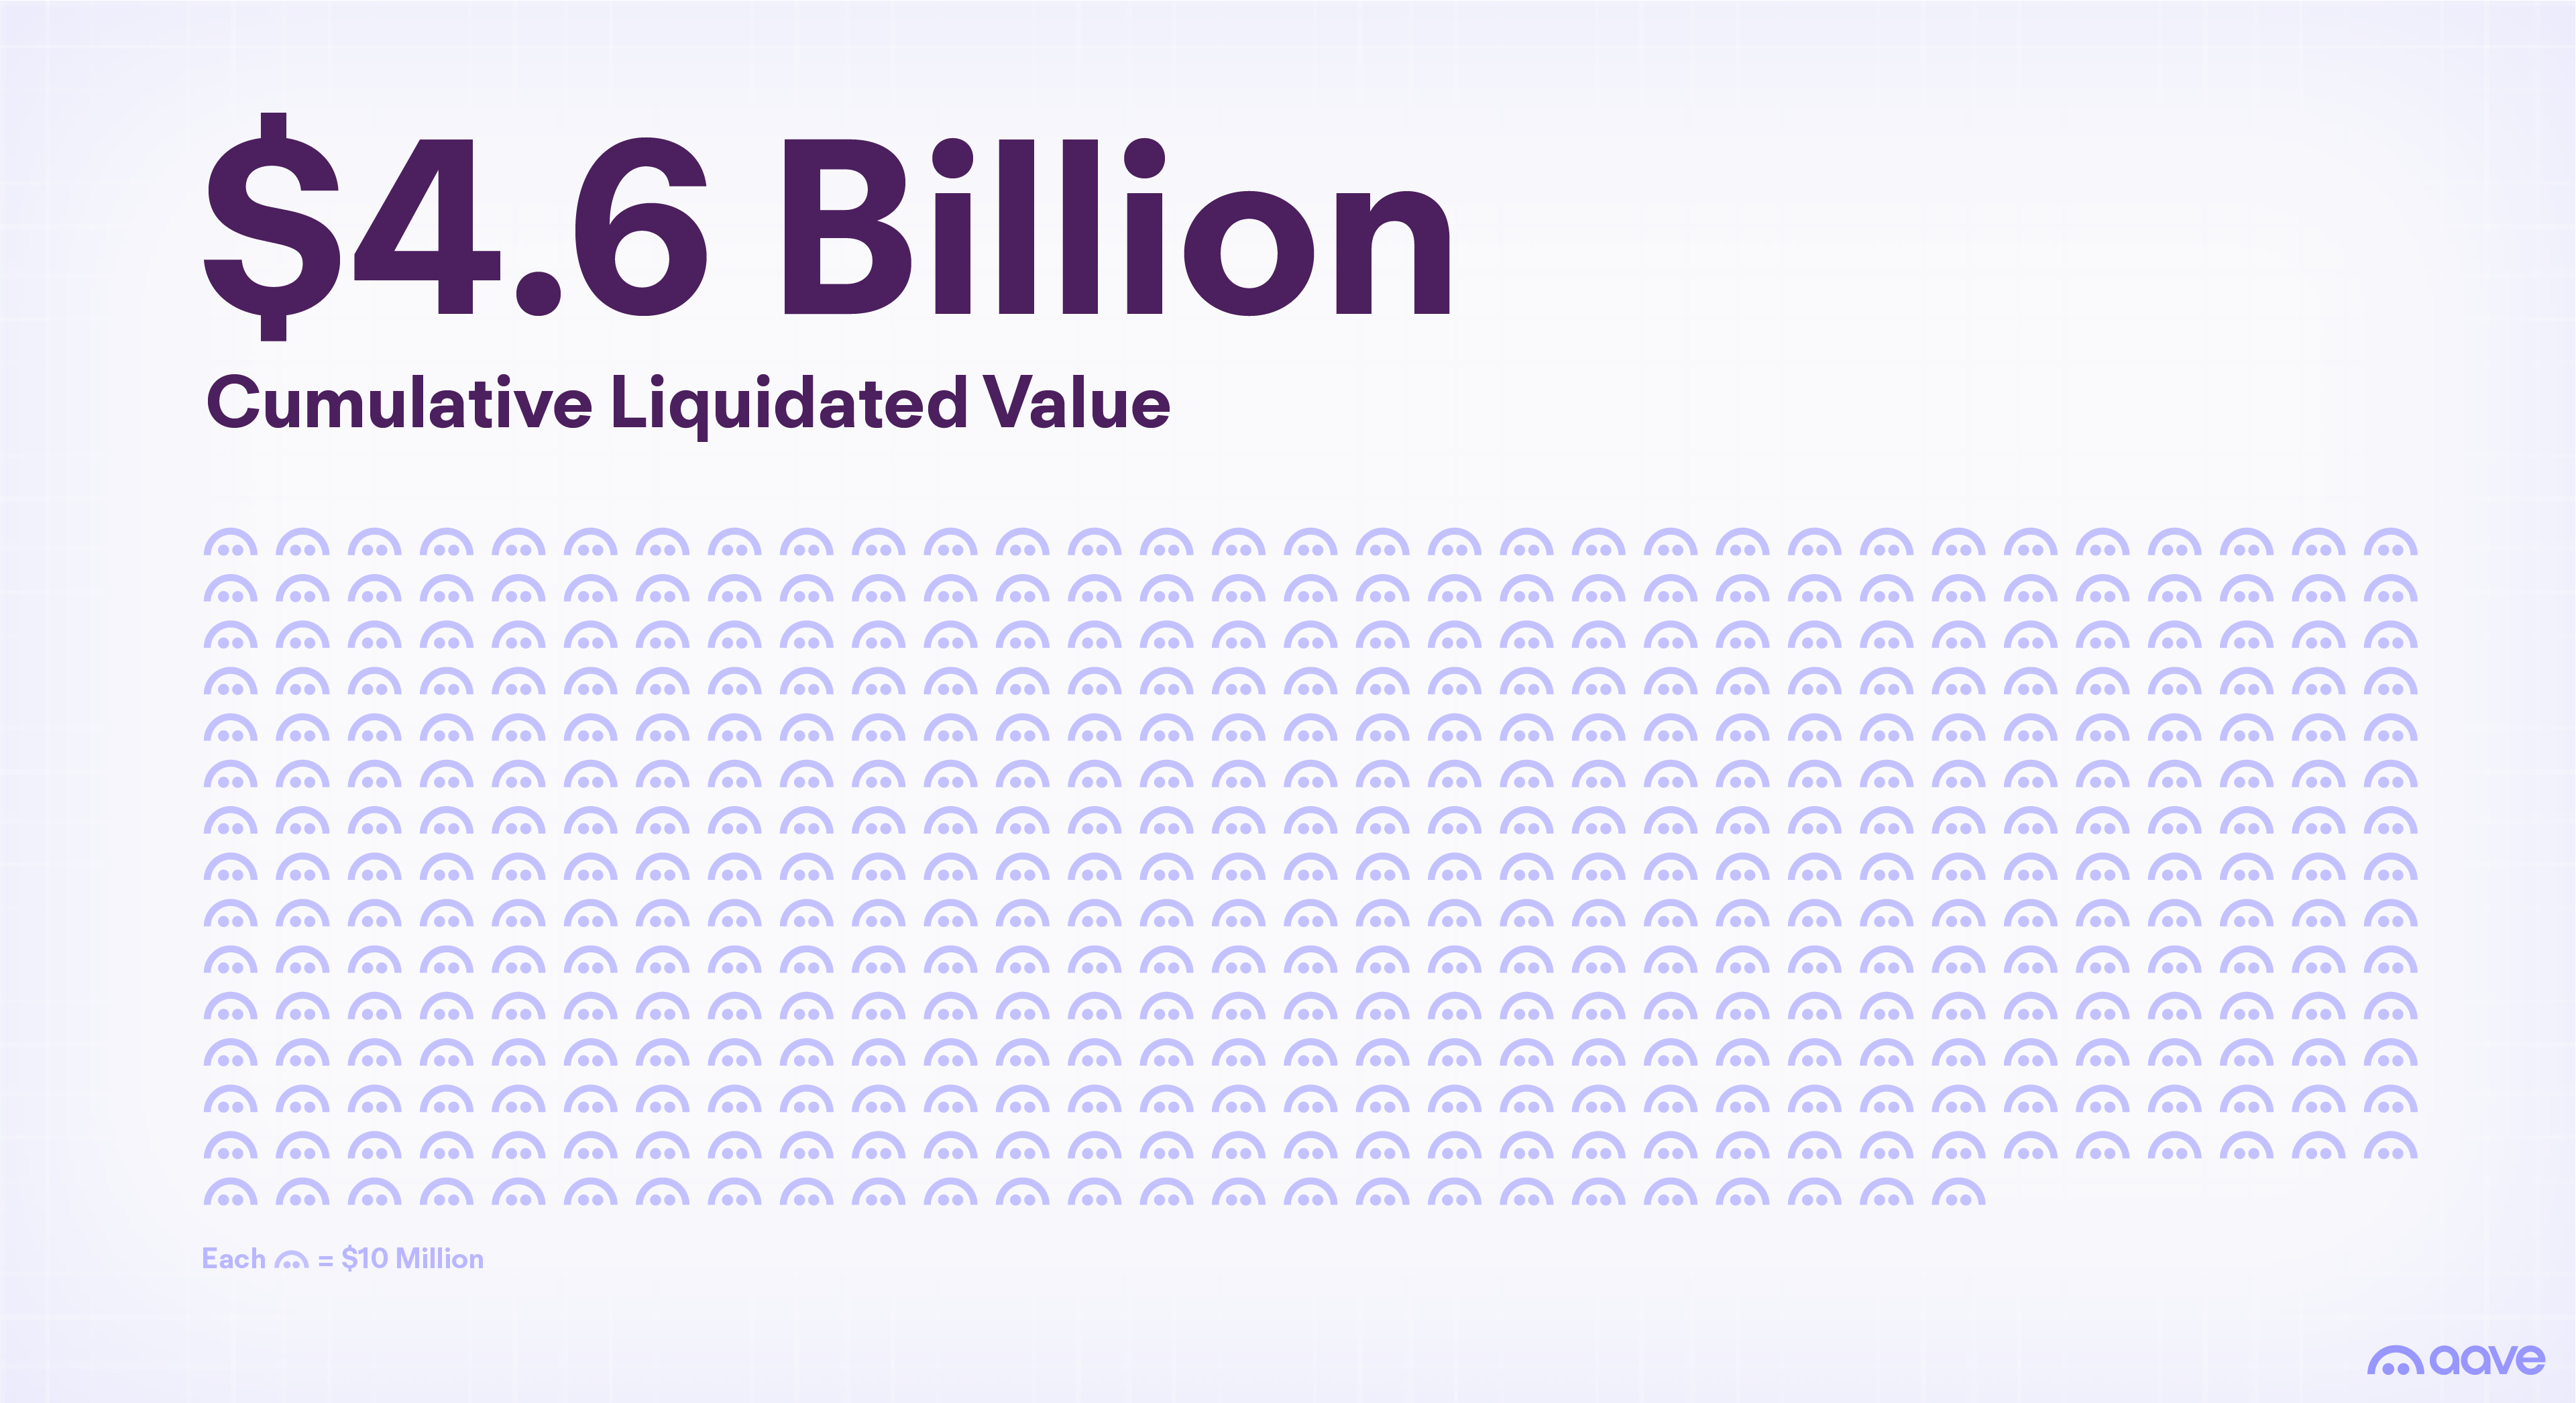
The on-chain discount is not charity. Overcollateralization plus automated liquidation removes most credit risk, so lenders accept less. Aave's report noted over $3 billion in liquidations across more than 250,000 events had executed automatically — the enforcement mechanism that keeps borrow rates low actually works at scale. If you are considering the borrow side of this market, read borrowing against crypto first.
Utilization explains how a rate is computed. It does not explain why utilization changes. For that you need the demand side: who wants to borrow stablecoins, and why.
The dominant driver is leverage demand. Most stablecoin borrowing on lending protocols funds long crypto positions — deposit ETH, borrow USDC, buy more ETH. When crypto markets rally, leverage demand rises, utilization climbs, and stablecoin lending rates rise with it. When markets chop or fall, demand unwinds and rates sag back toward the floor.
That links DeFi rates directly to the forces that move crypto prices. Research published by Uniswap Labs in July 2024, decomposing crypto price movements into underlying factors, found that crypto-specific demand and monetary policy were the two forces that mattered most over the 2019–2024 sample — with conventional risk appetite playing a surprisingly small role. The chart below is from that research.
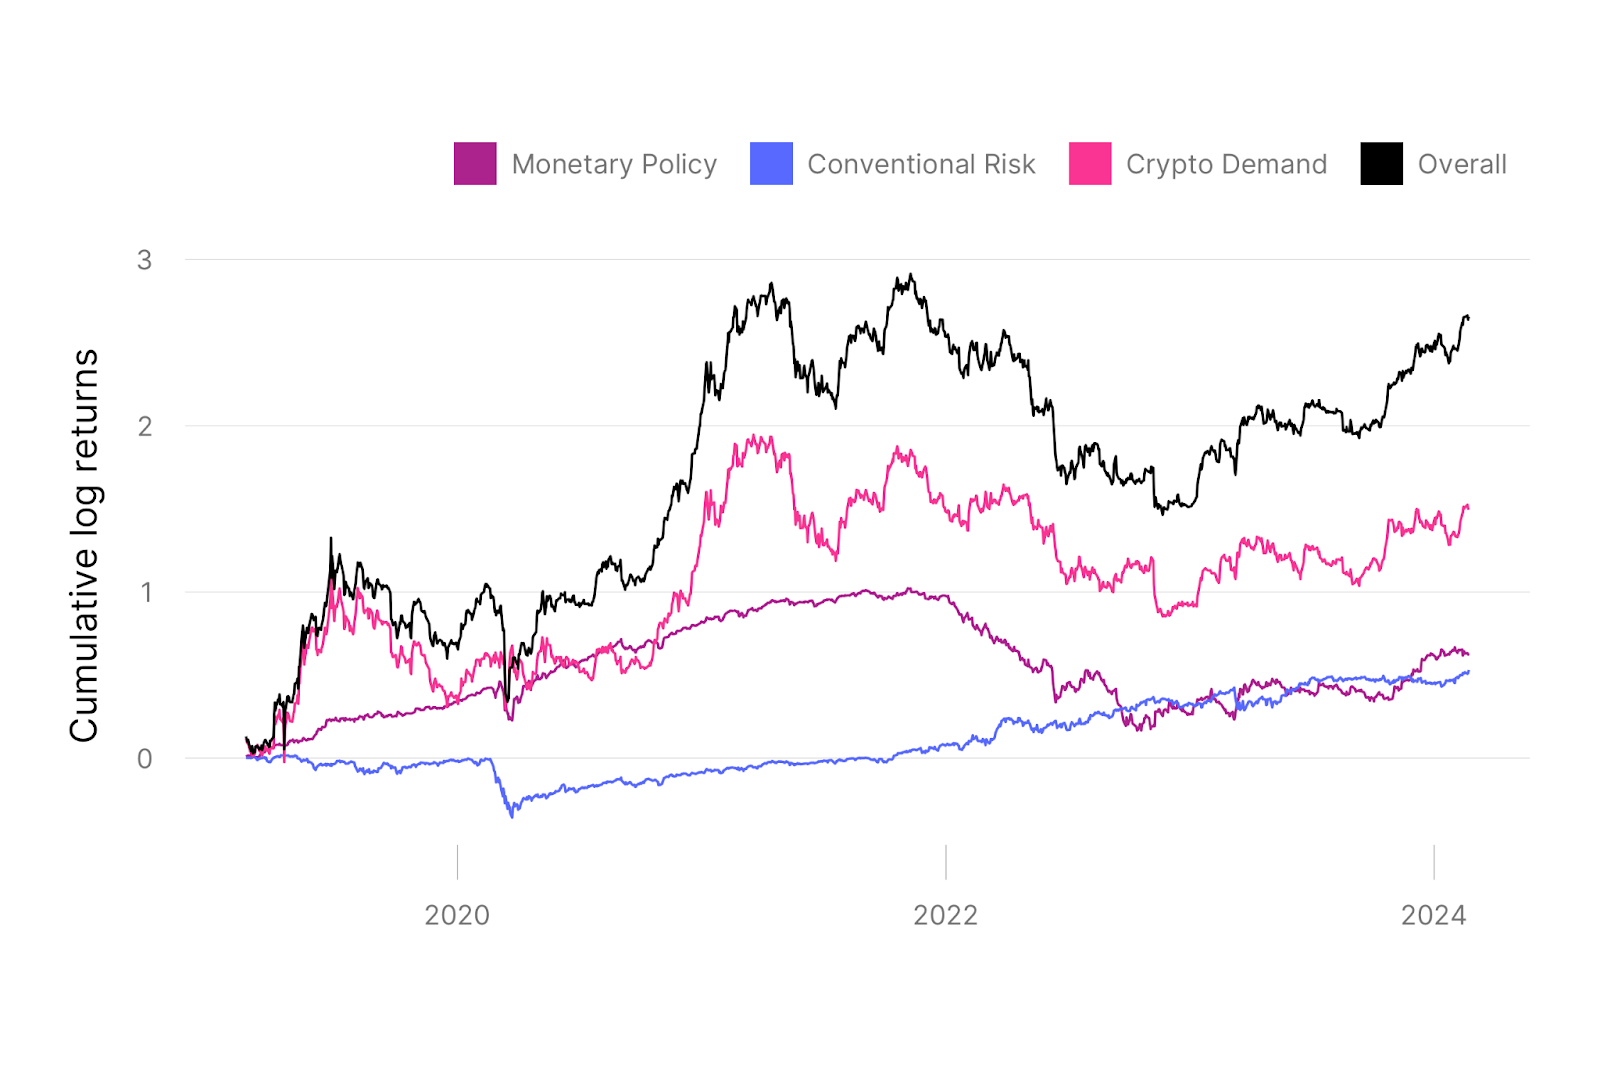
The monetary policy channel works twice. Tighter policy pressures crypto prices, cooling leverage demand. It also raises the yield on Treasury bills — the main competitor for stablecoin capital. When T-bills pay 5%, a 4% on-chain rate struggles to attract deposits, so on-chain rates get pulled upward toward the risk-free rate plus a spread. When policy eases, both effects reverse.
The third force is incentives. Protocols and chains subsidize rates with token emissions to attract liquidity. Those subsidies follow published schedules and shrink over time — Curve's August 2026 emission update, for example, cut annual CRV emissions by 15.9% (from 115.5 million to 97.2 million CRV per year, about 266,197 CRV per day) as its sixth epoch began. An APY propped up by emissions falls as the schedule steps down, even if utilization never moves. Always separate the base rate from the incentive layer before comparing venues — our stablecoin yield guide shows how to do that line by line.
More in Lending & Borrowing
Why stablecoin markets anchor everything
DeFi lending rates are quoted on many assets, but the market's center of gravity is stablecoins. The reason shows up clearly in trading data: on-chain activity clusters around ETH and dollar-pegged tokens, with a handful of bridge pairs connecting everything back to dollars.
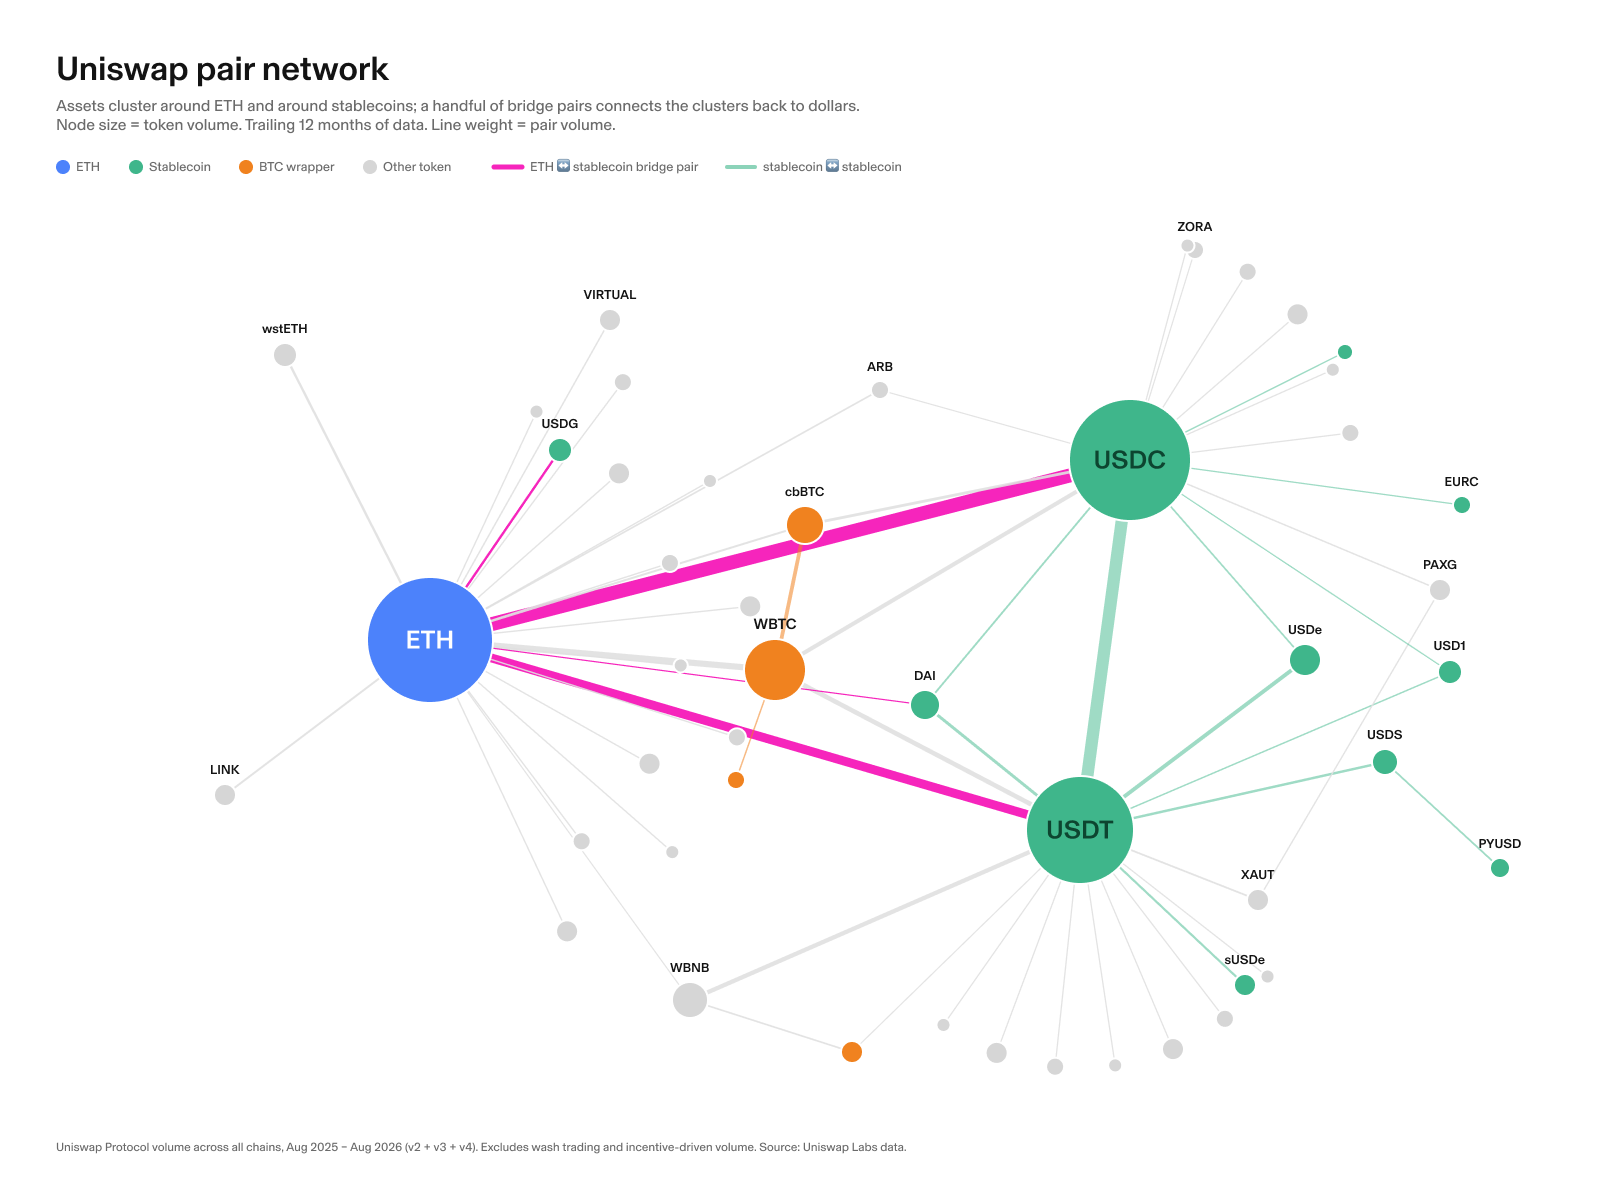
Because dollars are what traders borrow, dollar markets are where rate discovery happens. USDC and USDT pools on major protocols are the deepest, reprice the fastest, and set the benchmark that smaller stablecoins and exotic collateral markets price against. When you hear "DeFi lending rates are up," it almost always means stablecoin borrow demand rose.
This is also why rate quality varies by asset. A major stablecoin market with billions in supply gives you a rate backed by thousands of independent borrowers. A small market for a thinly traded token can show a spectacular APY driven by one borrower and collapse the moment that position closes. Depth is part of the rate.
A lending APY is one of several yield numbers you will see on-chain, and they are not interchangeable. Liquidity pool fee yields — like the tokenized equity pools now live on Uniswap v4 — pay trading fees rather than interest, and carry price risk between the paired assets that lending does not.
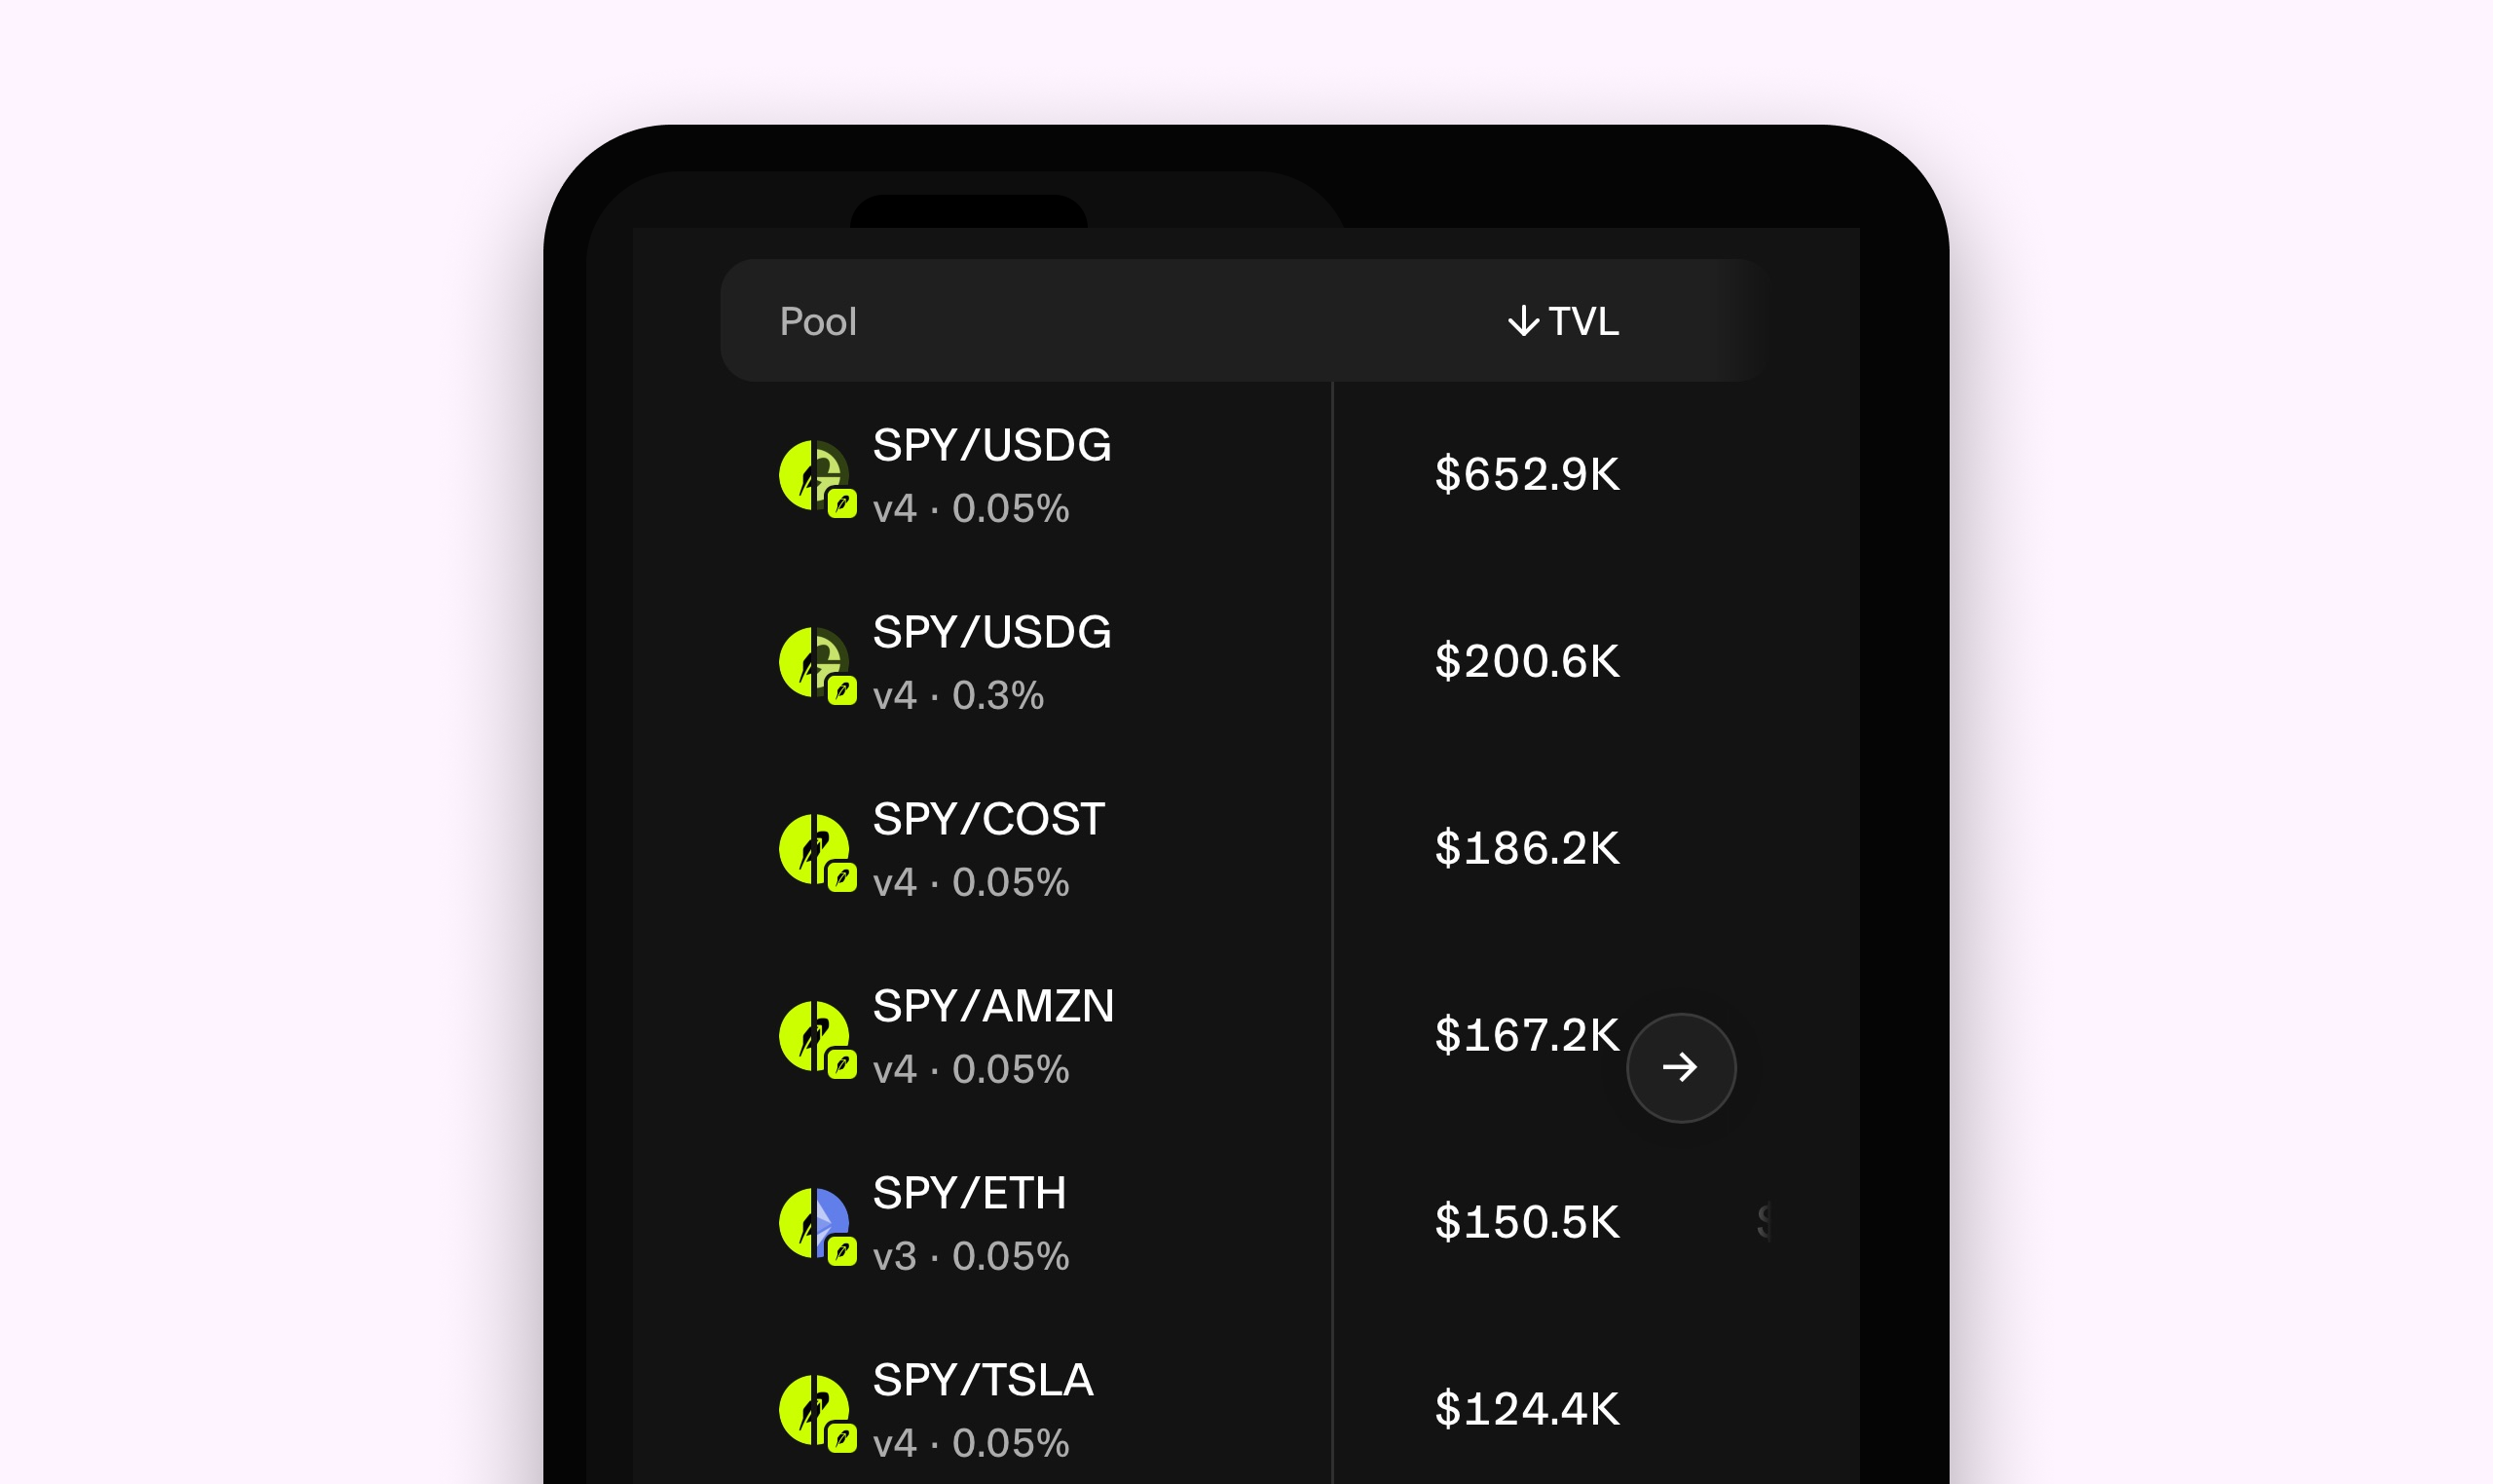
The clean way to think about it: a lending rate pays you for credit and liquidity risk with no price exposure beyond the asset you deposit. A pool fee yield pays you for absorbing other people's trades and can lose principal to divergence between the paired assets. Staking yield pays you for validating a network and moves with issuance rules. When a dashboard shows all three as "APY," you must know which risk you are being paid for — a 5% lending rate and a 5% LP yield are entirely different products. Our protocol safety guide walks through the risk checklist for each.
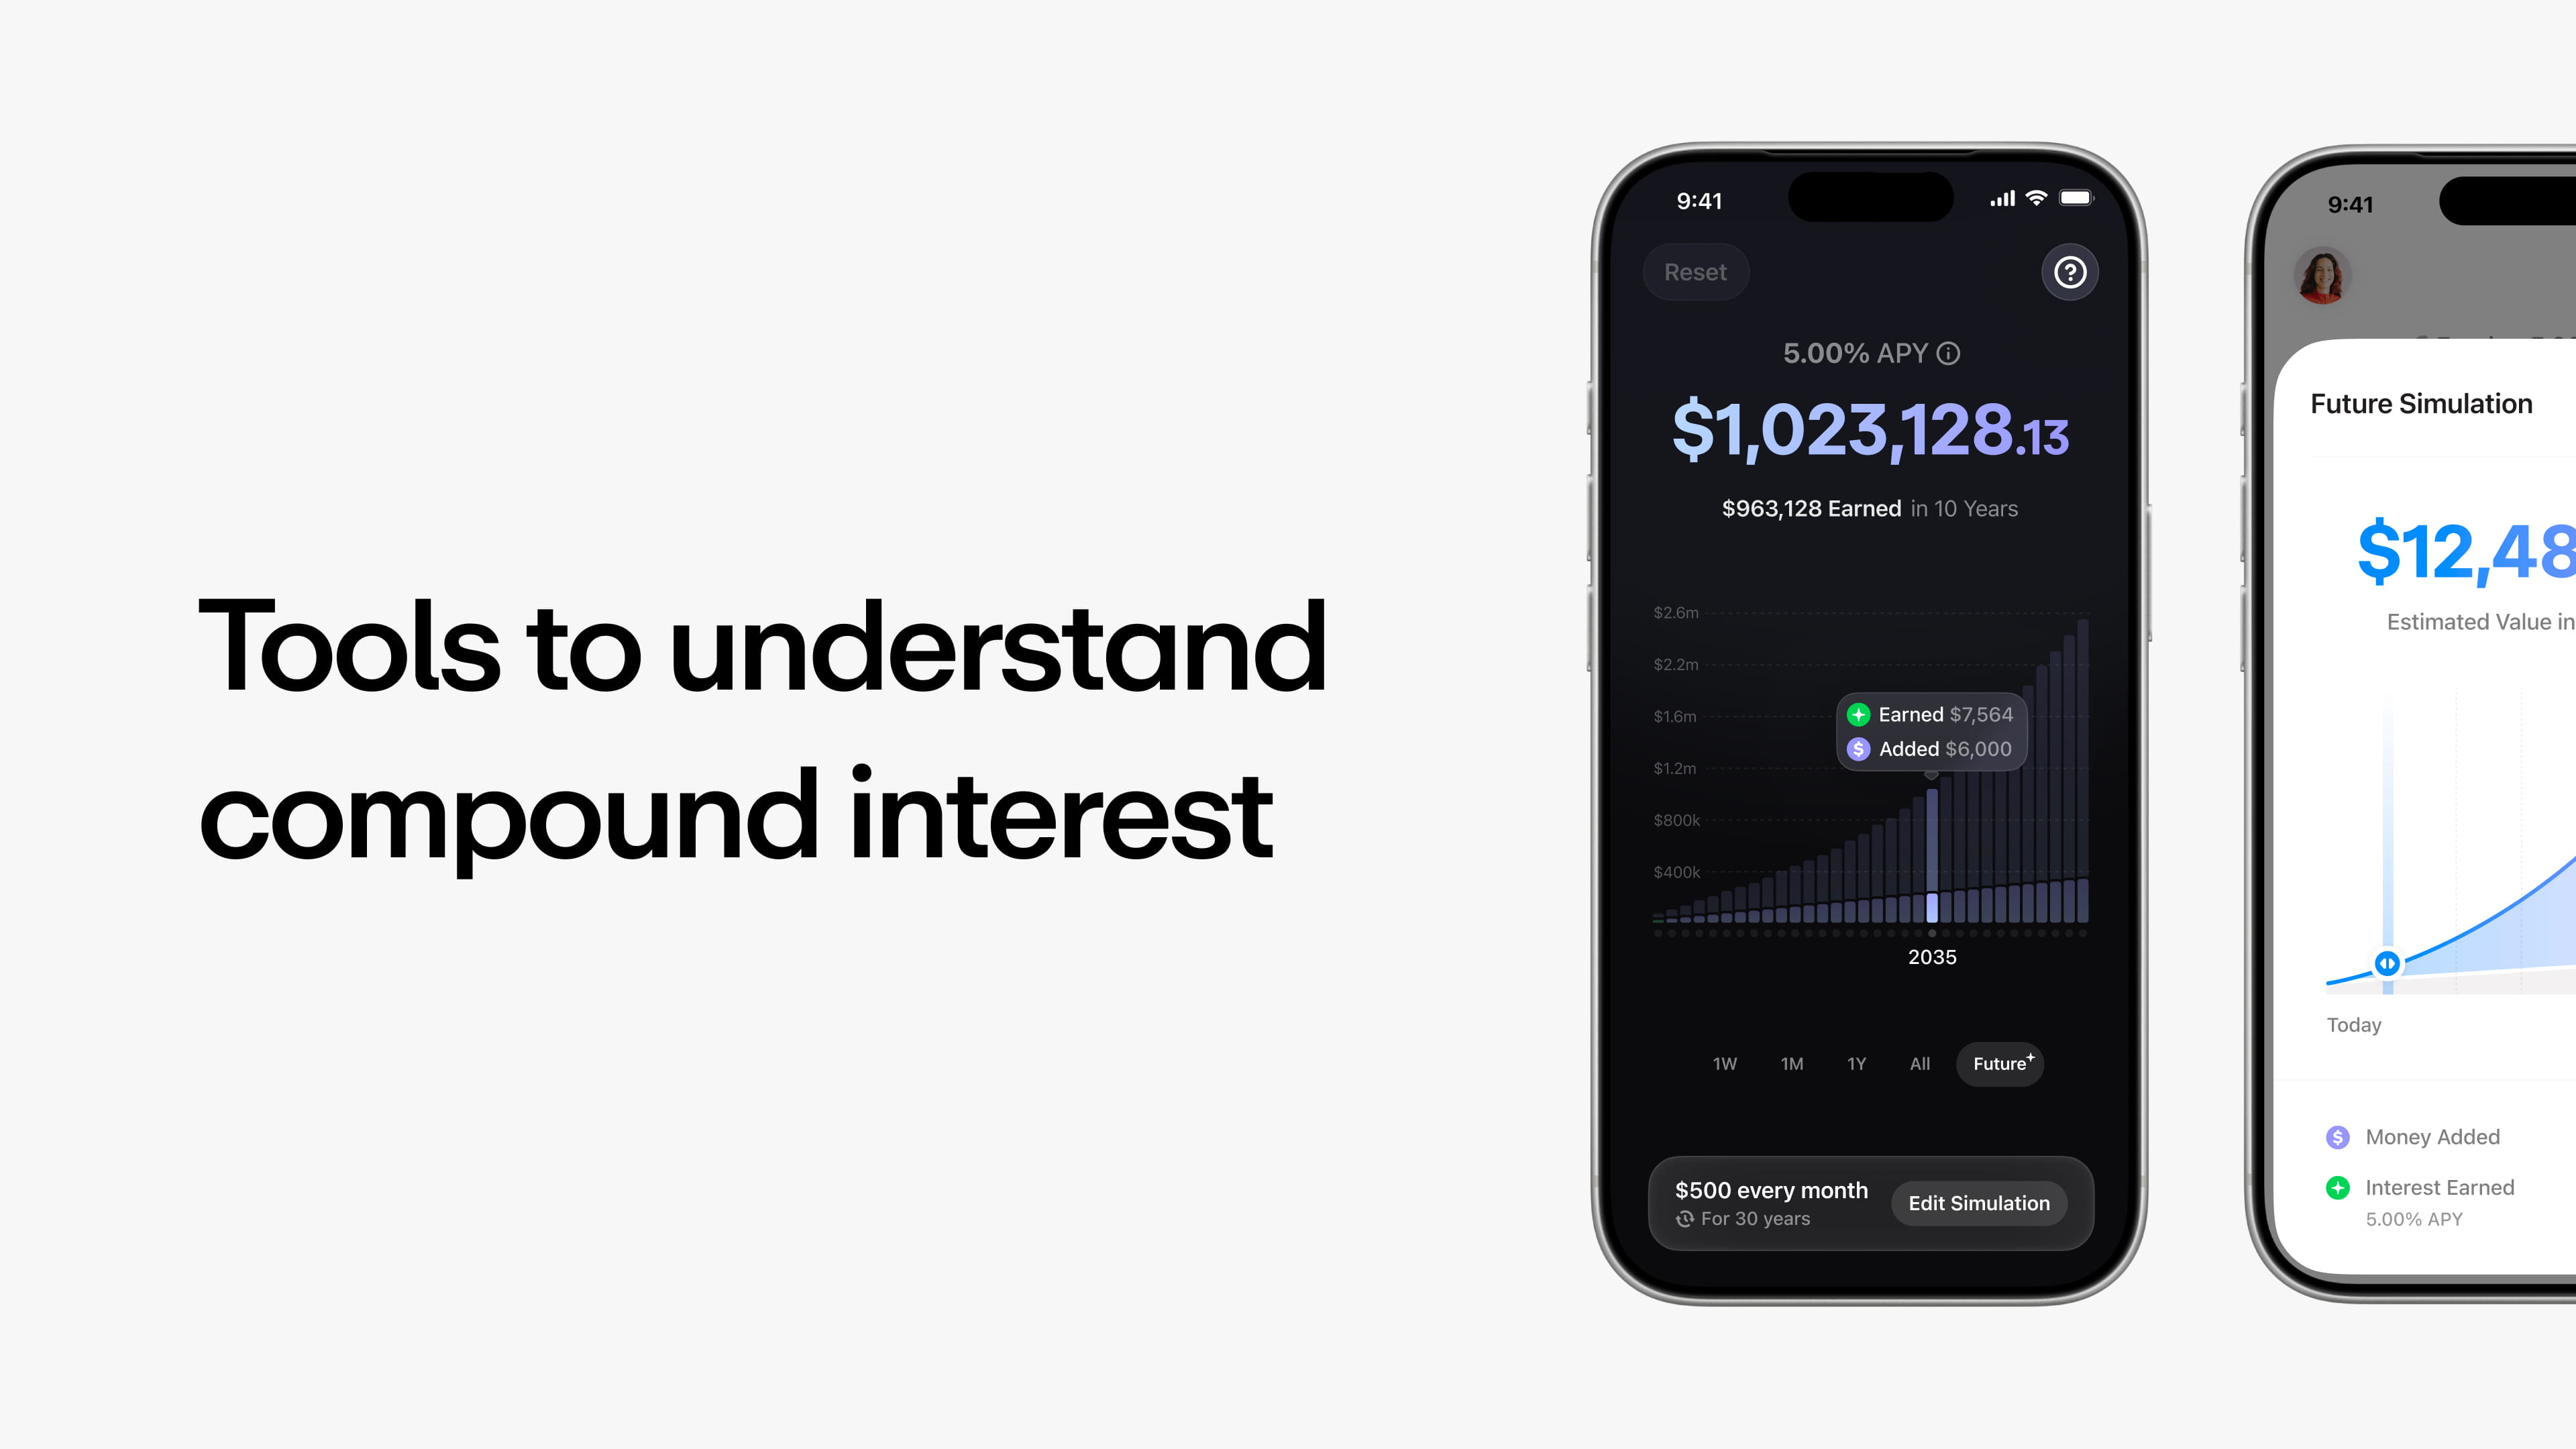
Consumer apps are collapsing this complexity into savings-style products, which makes rate literacy more important, not less. The Aave app's compound simulator, for instance, shows a saver what $500 per month at 5.00% APY becomes over 30 years — a genuinely useful illustration, as long as the user understands the 5% is variable.
How to compare rates before you deposit
A repeatable checklist beats chasing the biggest number:
- Find the base rate. Strip out token incentives and look at what borrowers are actually paying. Most dashboards show "supply APY" and "reward APR" separately.
- Check utilization. A rate produced at 95% utilization is a stress signal, not a bargain. Rates formed between roughly 60% and 90% utilization are the market's normal operating range.
- Look at the average, not the instant. Seven-day and thirty-day trailing averages smooth out spikes. A market averaging 5% that briefly shows 12% will revert.
- Compare against the risk-free rate. If T-bills pay more than the on-chain rate, the market is telling you the extra risks are not currently being compensated.
- Size the market. Billions in supply means real rate discovery; a few million means one whale sets your yield.
- Confirm the withdrawal path. A great rate you cannot exit is a trap. Check available liquidity — supply minus borrows — before depositing.
The same checklist works on the borrow side, inverted: borrow when utilization is low and average rates are near the floor, and stress-test your position against the spike scenario. The risks that surround both sides — liquidation, oracle failure, depegs — are covered in DeFi lending risks.
- Treating the displayed APY as fixed. Every major on-chain lending rate is variable and reprices continuously. The number you deposited at is not the number you will earn next month, and no protocol owes it to you.
- Chasing incentive-inflated yields. An APY that towers over the market band is almost always token emissions, and emission schedules step down on published timetables — Curve's 15.9% annual cut in August 2026 is typical of how these subsidies shrink.
- Ignoring utilization when the rate looks great. A double-digit stablecoin rate usually means utilization has blown past the kink. You are being paid because withdrawals are constrained — that is compensation for a real risk, not free money.
- Comparing lending APYs against LP or staking yields as if they were the same product. Each pays for a different risk. A lending rate carries no divergence loss; an LP yield does. Mixing them in one comparison table leads to systematically buying the wrong risk.
Which approach fits your situation
"We are a crypto-native saver with a stablecoin buffer we want working instead of idle." Park it in the deepest stablecoin market on a top-tier protocol, accept the 4–6% band as the honest price of low-risk on-chain yield, and ignore anything advertising triple that. Check the thirty-day average monthly, not daily.
"We are a trader who borrows stablecoins for leverage a few times a year." Your cost driver is timing. Borrow when utilization is mid-range and unwind before funding crowds in during rallies. Set alerts on the borrow rate — the spike above the kink is what turns a profitable trade into a losing one.
"We are a small fund doing treasury management across chains." Build your comparison on base rates net of incentives, weight by market depth and withdrawal liquidity, and benchmark everything against short-duration Treasuries. The on-chain spread over T-bills is your actual compensation for smart contract and depeg risk — track that spread, not the headline APY.
Frequently asked questions
What is a normal DeFi lending rate for stablecoins?
In recent cycles, supply rates on major protocols have mostly ranged between roughly 4% and 6% for USDC and USDT, with borrow costs in a similar band per Aave's September 2025 report. Bull markets push the band up; quiet markets pull it toward the floor. Anything dramatically above the band is usually incentives or stress.
Why did my APY drop after I deposited?
Either borrowers repaid (utilization fell, so the rate fell), new depositors diluted the pool, or a token incentive program stepped down. All three are normal. Rates on utilization-curve protocols are variable by design and reprice every block.
Are higher DeFi rates always riskier?
Within one asset class, mostly yes. A stablecoin market paying far above the benchmark is compensating for something — thin liquidity, a riskier collateral base, protocol risk, or unsustainable emissions. Across asset classes, a higher number may simply be a different product, like LP fee yield with divergence risk attached.
Do DeFi lending rates follow the Fed?
Indirectly but meaningfully. Monetary policy moves crypto prices and leverage demand, per Uniswap Labs' 2024 factor research, and Treasury yields set the opportunity cost for stablecoin capital. On-chain rates tend to trade at a spread to the risk-free rate that widens and narrows with crypto demand.
Can a DeFi lending rate be negative or go to zero?
Supply rates approach zero when utilization collapses — no borrowers means nothing to distribute. They do not go negative on major protocols. You can still lose money at a positive rate, though, through depegs, exploits, or gas costs exceeding small-balance yields.
Sources
- Aave, "Crypto-Backed Loans: On-Chain Lending at Scale" — September 17, 2025. Rate bands (4–6% on-chain vs 8–12% CeFi vs 10–15%+ personal loans), $3T cumulative deposits, $850B cumulative loans, liquidation statistics.
- Uniswap Labs, "New Research on Drivers of Crypto Asset Prices" — July 30, 2024. Factor decomposition showing crypto demand and monetary policy as dominant drivers.
- Uniswap Labs, "Correlated Pairs: How AMMs Win the Biggest Markets" — August 18, 2026. Pair network volume clustering around ETH and stablecoins; SPY pool data.
- Aave, "The Aave App Reimagines the DeFi Experience" — March 3, 2026. Consumer savings interface and compound simulator screenshots.