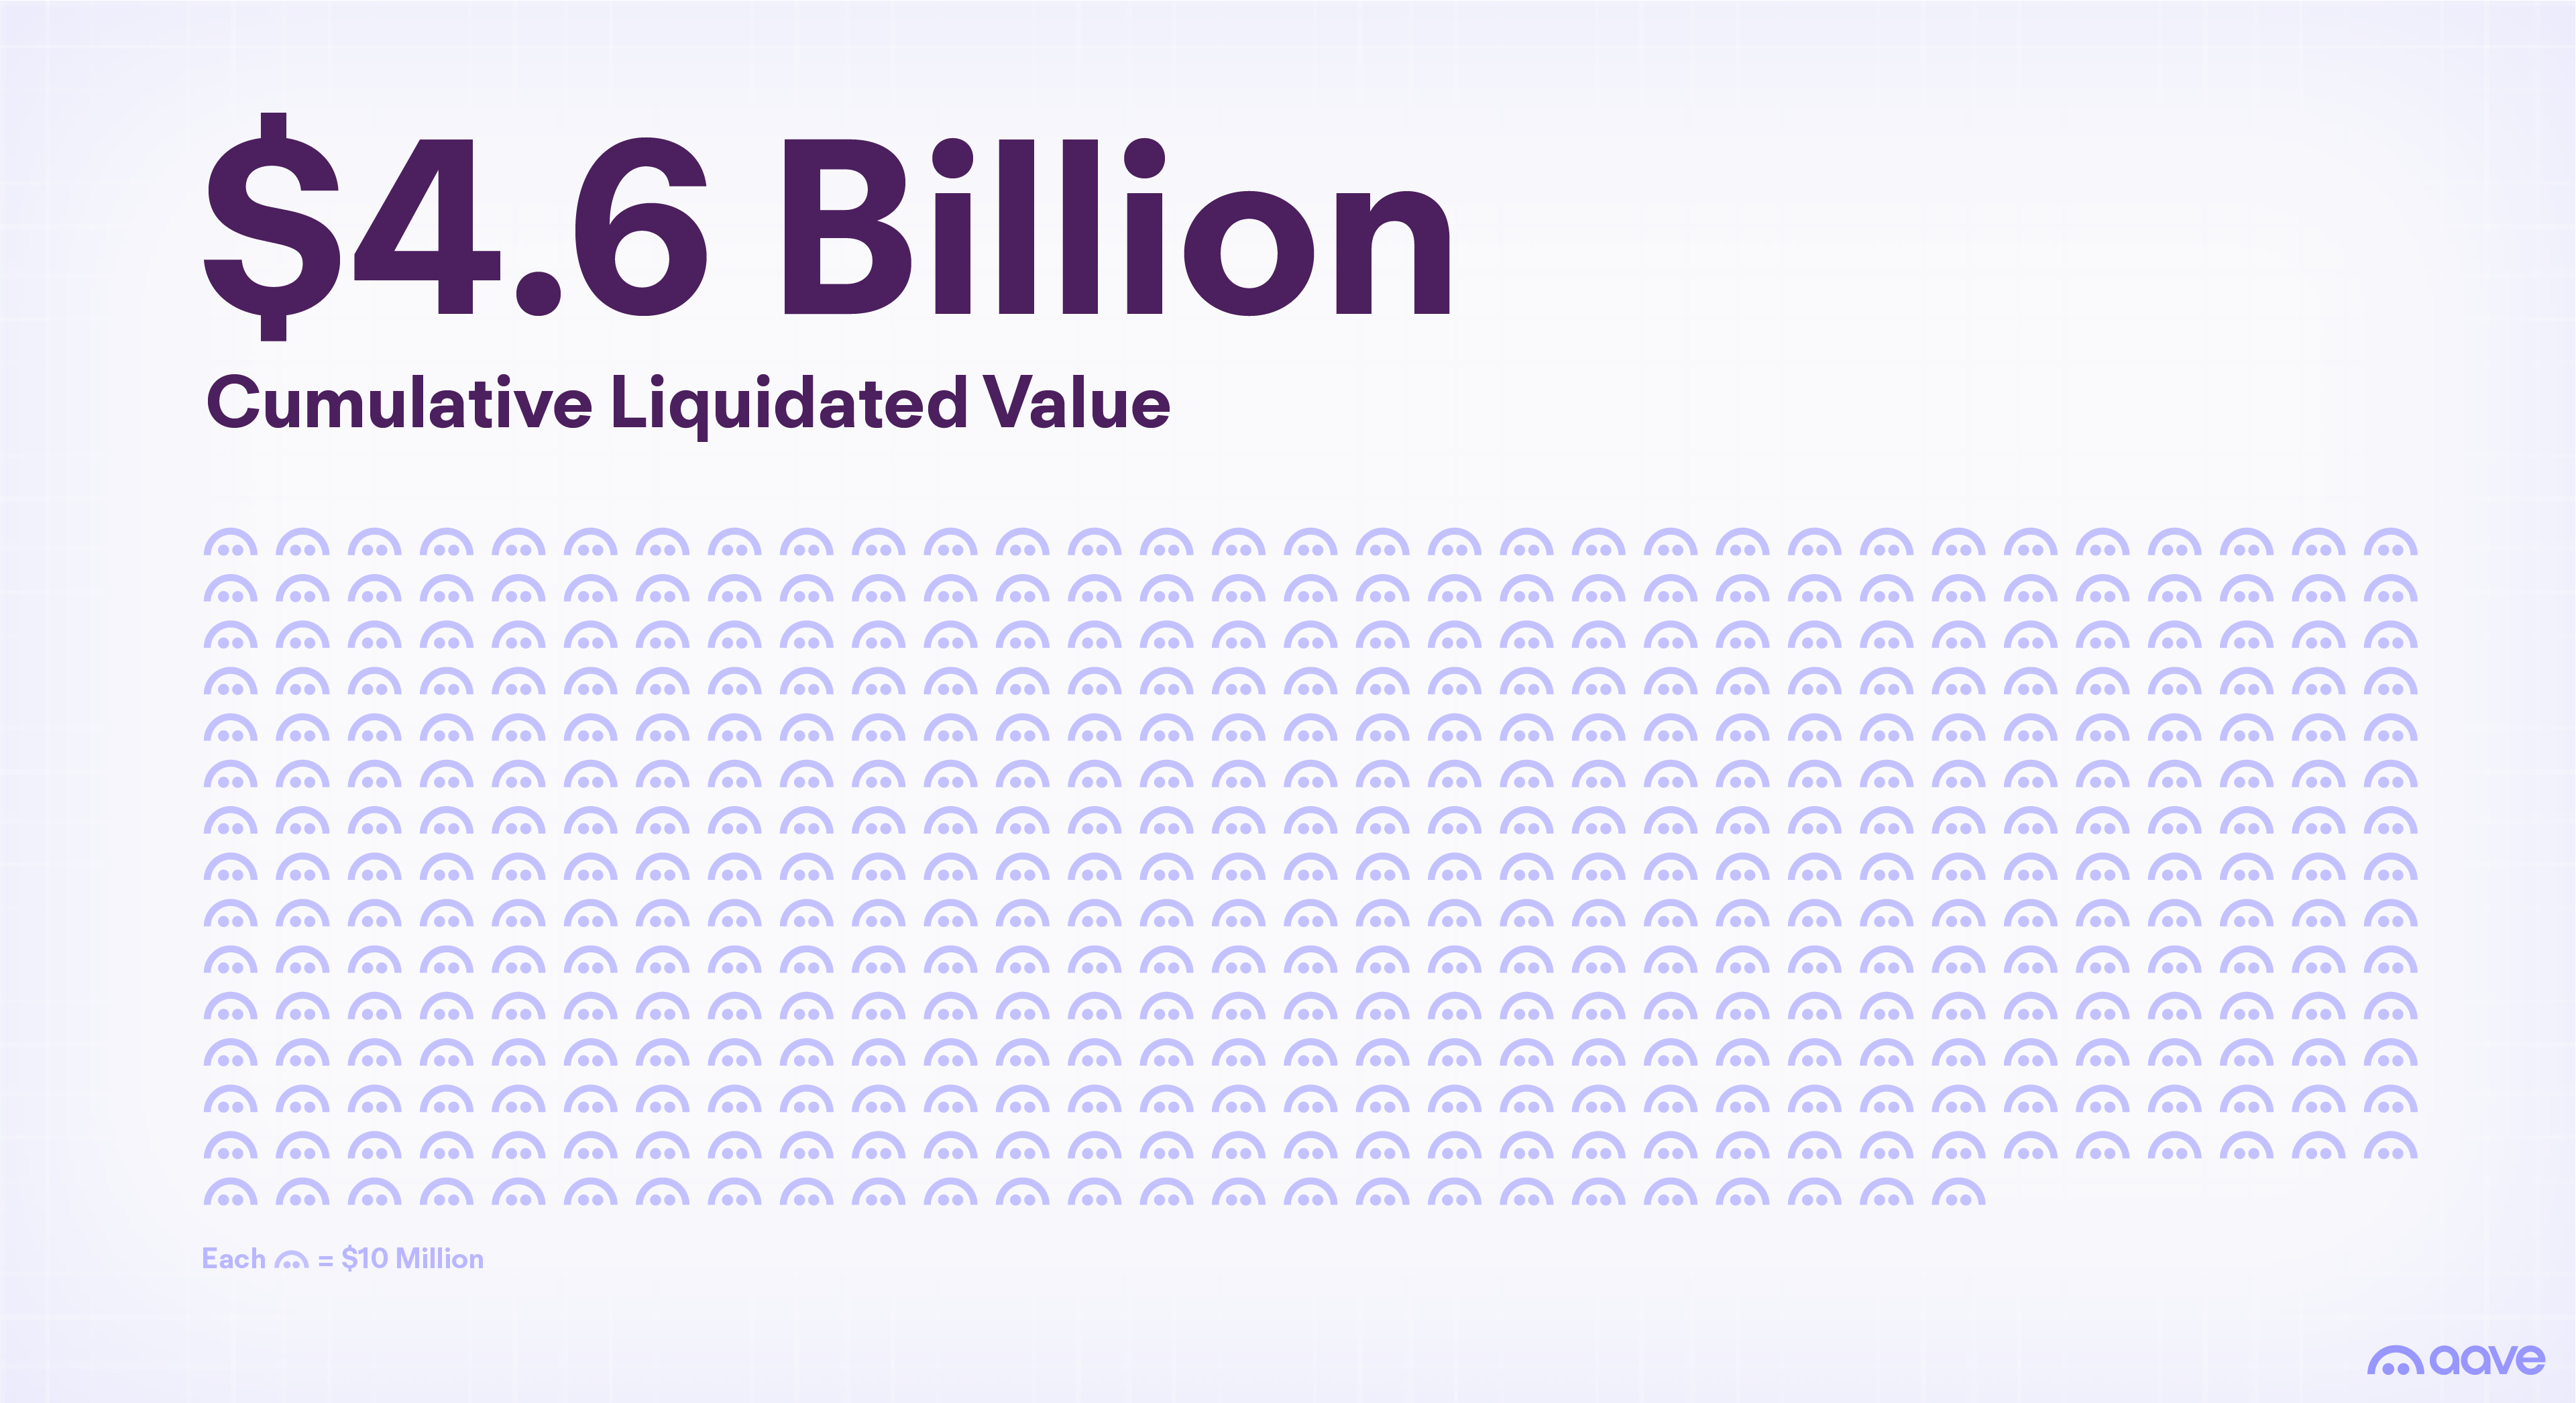
If you are weighing whether to lend or borrow on a DeFi protocol, the honest starting point is that the risks are not hypothetical. Aave, the largest DeFi lending protocol, has processed more than 310,000 liquidations totaling $4.65 billion since its 2020 launch, according to research its team published in February 2026. That figure is not a scandal — it is the protocol's safety mechanism working as designed, over and over, through five separate market crashes. But every one of those 310,000 events was a real borrower losing real collateral, and understanding exactly how and when those losses happen is the difference between using DeFi lending deliberately and stumbling into it.
This guide walks through the actual loss mechanisms in DeFi lending — liquidation, oracle failure, smart-contract exploits, bad debt, and stablecoin depegs — using published data from the protocols themselves rather than abstract warnings. The numbers tell a more specific story than "crypto is risky," and that specificity is what lets you manage the exposure.
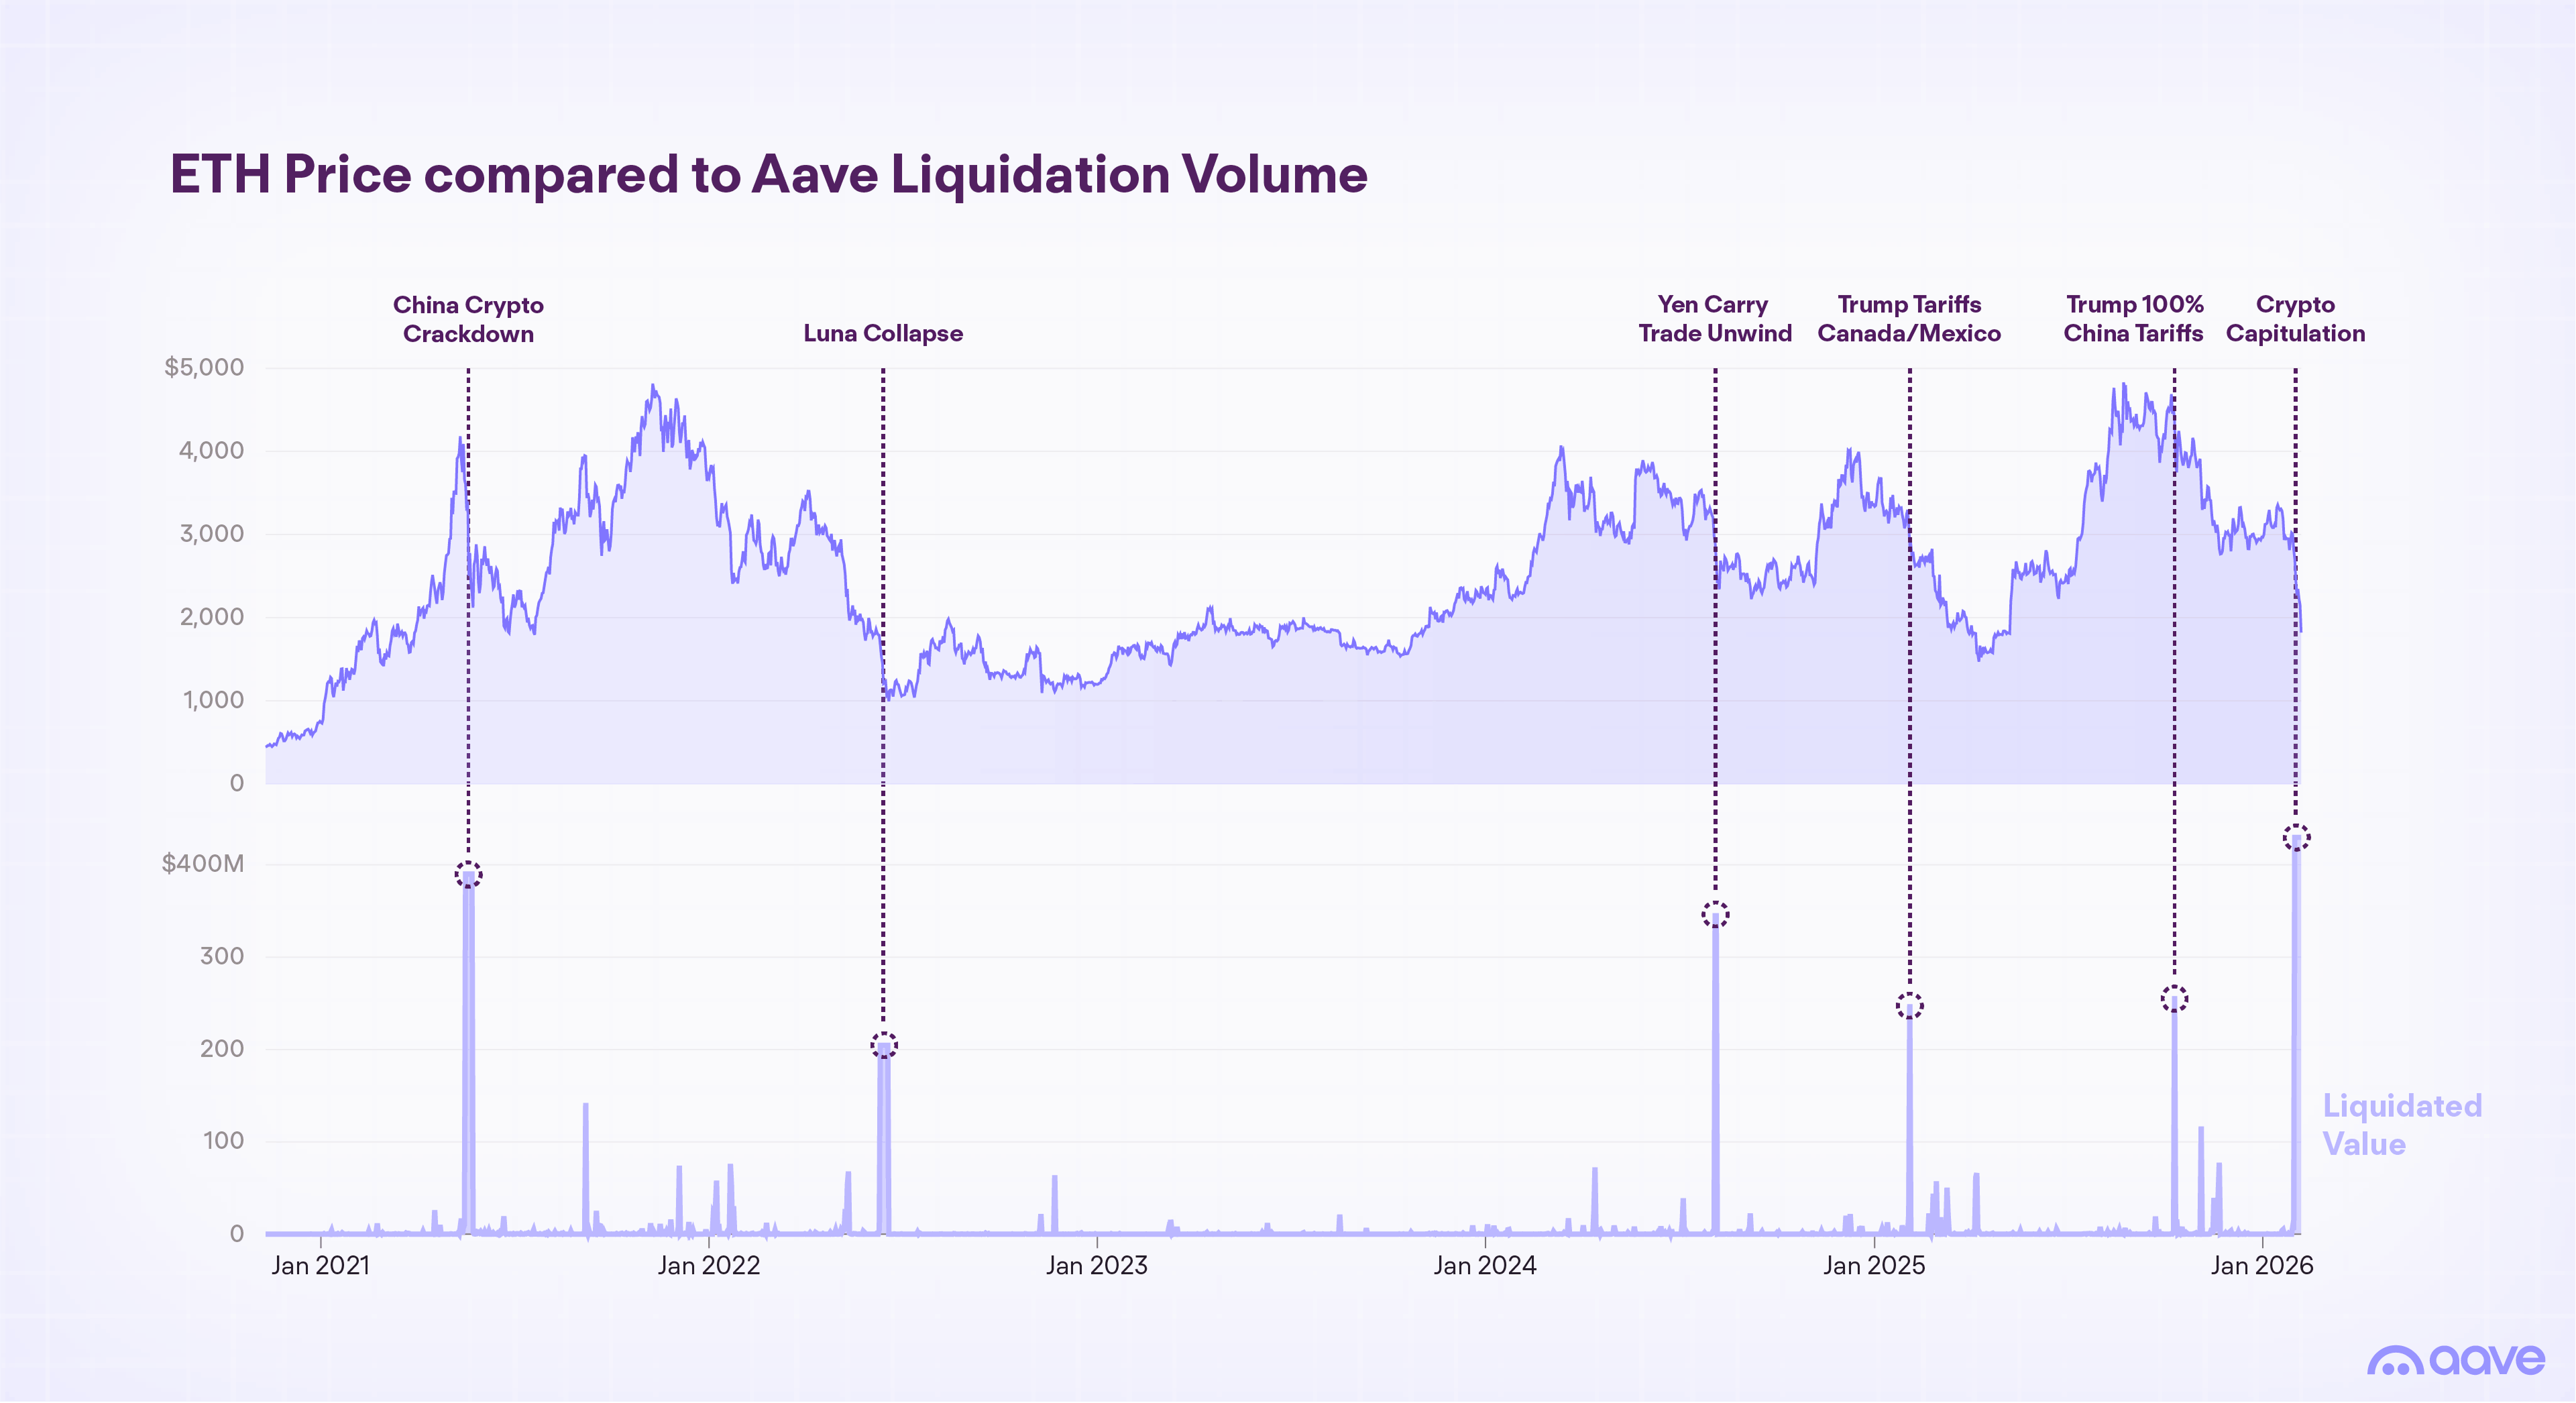
Image: Aave Labs — five years of Aave liquidation volume plotted against the ETH price, with the major deleveraging events labeled, from the protocol's February 2026 liquidation study.
Quick solution
If you want the risk-management checklist without the full analysis: borrow at no more than half the maximum loan-to-value your protocol allows, so a 30–40% overnight drawdown — which has now happened at least four times since 2021 — does not liquidate you. Prefer major collateral (ETH, BTC, large-cap liquid staking tokens) over volatile long-tail assets, which get liquidated at disproportionate rates. Lend only on protocols that publish incident histories, run active risk management, and carry capitalized backstops. Check the protocol's bad-debt record before its advertised yield. And treat any yield meaningfully above the market rate for the same asset as compensation for a risk you have not identified yet — because it is.
Everything below is the evidence for those five sentences.
Liquidation is the risk DeFi borrowers actually experience, so it deserves the most attention. The February 2026 Aave study is the best public dataset on the subject, and its aggregate numbers frame the base rate: 310,000 liquidations against 9 million cumulative borrow transactions — about 3.3% of borrows end in liquidation — representing 0.45% of the $982 billion in all-time borrowing volume.
Two readings of that data are both true. The optimistic one: 96.7% of Aave borrow positions never get liquidated, and the protocol has processed every crash in its history with no downtime and no failure of the liquidation machinery. The cautionary one: liquidations are not evenly distributed. They cluster violently into a handful of days. When they arrive, they arrive by the hundreds of millions of dollars in a single week, and whether you are among them depends almost entirely on decisions you made weeks earlier about leverage.
The historical record of those clustering events is worth knowing by name:
- In May 2021, China's crackdown on crypto transactions triggered a drawdown that wiped out roughly half of crypto's total market value in a week. Aave V2 liquidated $362 million across more than 5,500 events, averaging about $65,000 per liquidation.
- In June 2022, the Luna collapse liquidated over 32,000 Aave positions in a week — nearly six times as many positions as the 2021 event, but only 60% of the dollar volume, reflecting a broader user base with smaller average positions.
- On October 10, 2025, a sudden market crash liquidated more than $250 million in a single day at an average of $68,000 per event. During that same event, Aave processed $1.7 billion in stablecoin withdrawals while keeping $700 million of USDC and USDT liquidity available.
- From January 31 to February 5, 2026, a capitulation selloff took BTC as low as $60,000 and ETH to $1,750 — down 30–40% over seven days. Aave liquidations totaled $429 million across roughly 12,500 transactions, a new record in dollar terms, though smaller than 2021 relative to the protocol's much larger deposits.
The pattern across those four events is the core lesson: each crash produced a 10–40% price move faster than most borrowers could react, often overnight or during hours when they were not watching. A liquidation buffer that assumes you will be awake to top up collateral is not a buffer. Position sizing has to survive the move happening while you sleep.
What actually gets liquidated: collateral and debt composition
The composition data from the same study explains who bears liquidation risk and how. By value of collateral seized, ETH-related assets dominate at 56%, followed by BTC-related assets at 18%, long-tail alternative assets at 15%, and stablecoins at 11%.
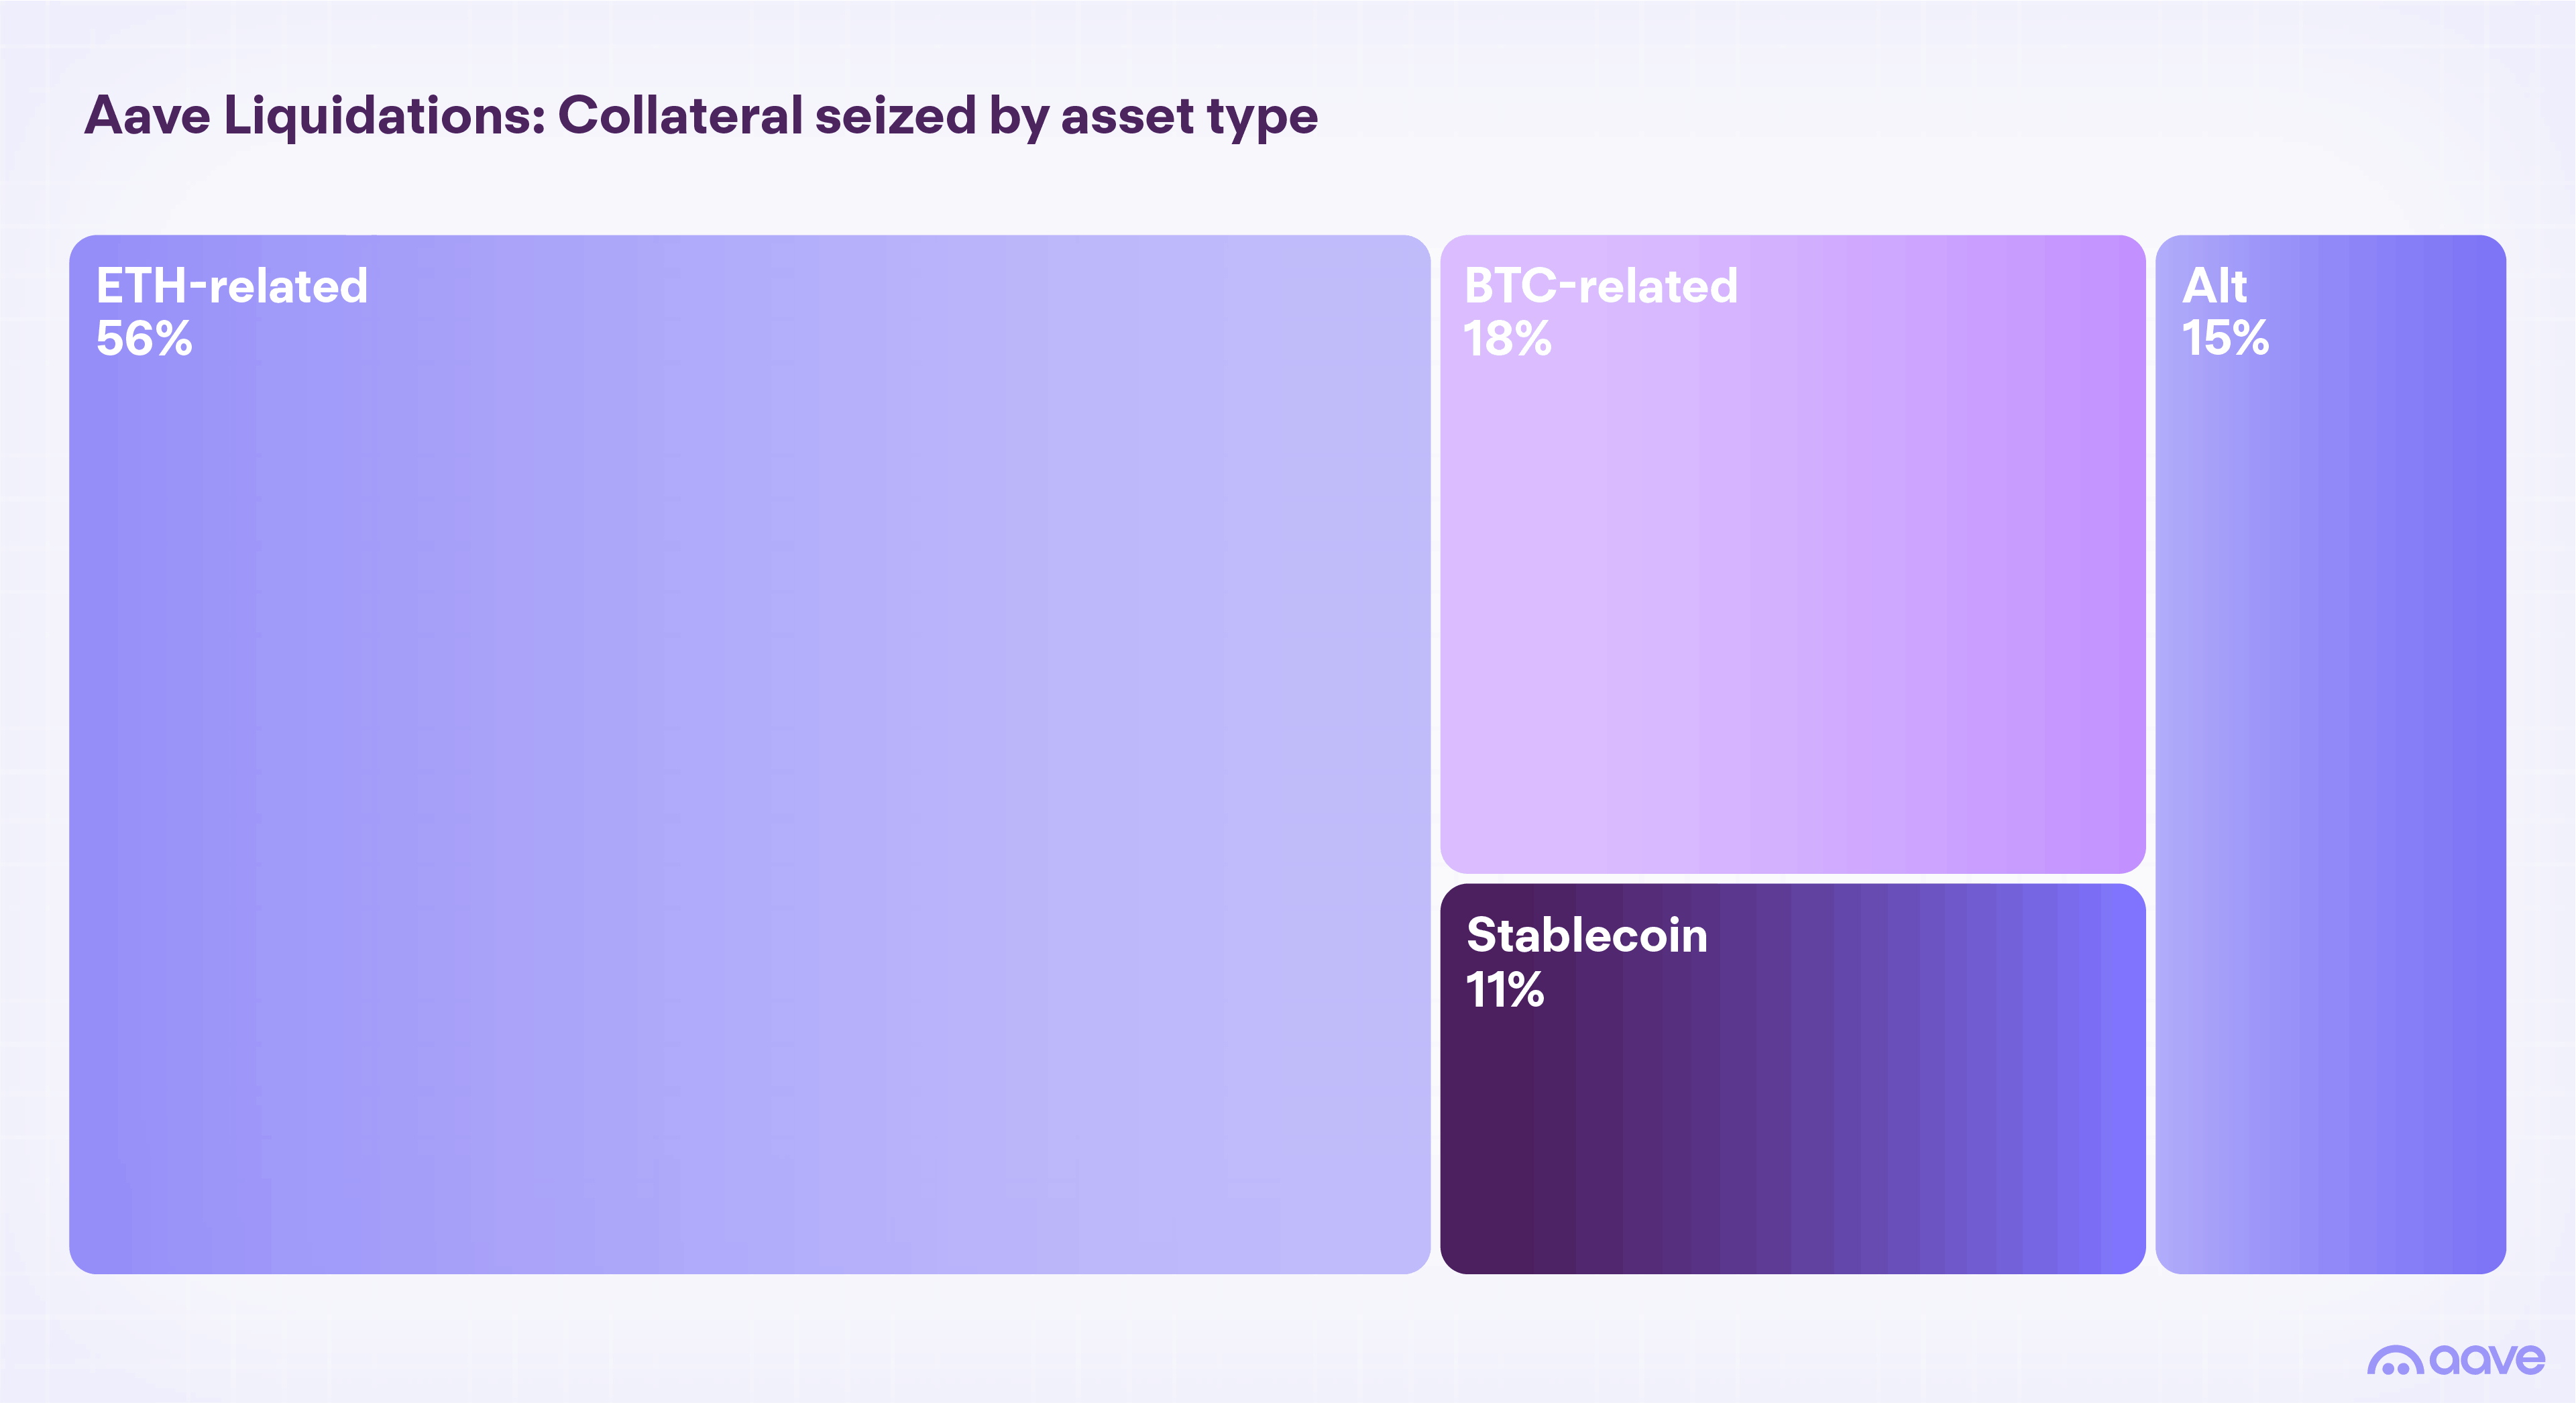
The ETH share is unsurprising — ETH dominates collateral deposits. The more instructive number is the 15% share held by long-tail "alt" assets, which is well above their share of deposits. Volatile assets get liquidated at disproportionate rates: they fall harder during crashes, and their thinner liquidity means the price impact of the liquidation itself is worse. If your collateral is a mid-cap token, your effective liquidation risk is materially higher than the same loan-to-value ratio against ETH.
The debt side of the ledger is even more lopsided. Stablecoins account for 91% of debt repaid through liquidations — because borrowing dollars against crypto collateral is what most DeFi lending actually is. We covered the mechanics of that trade in our guide to borrowing against crypto; the liquidation data confirms it is the dominant pattern at every scale.
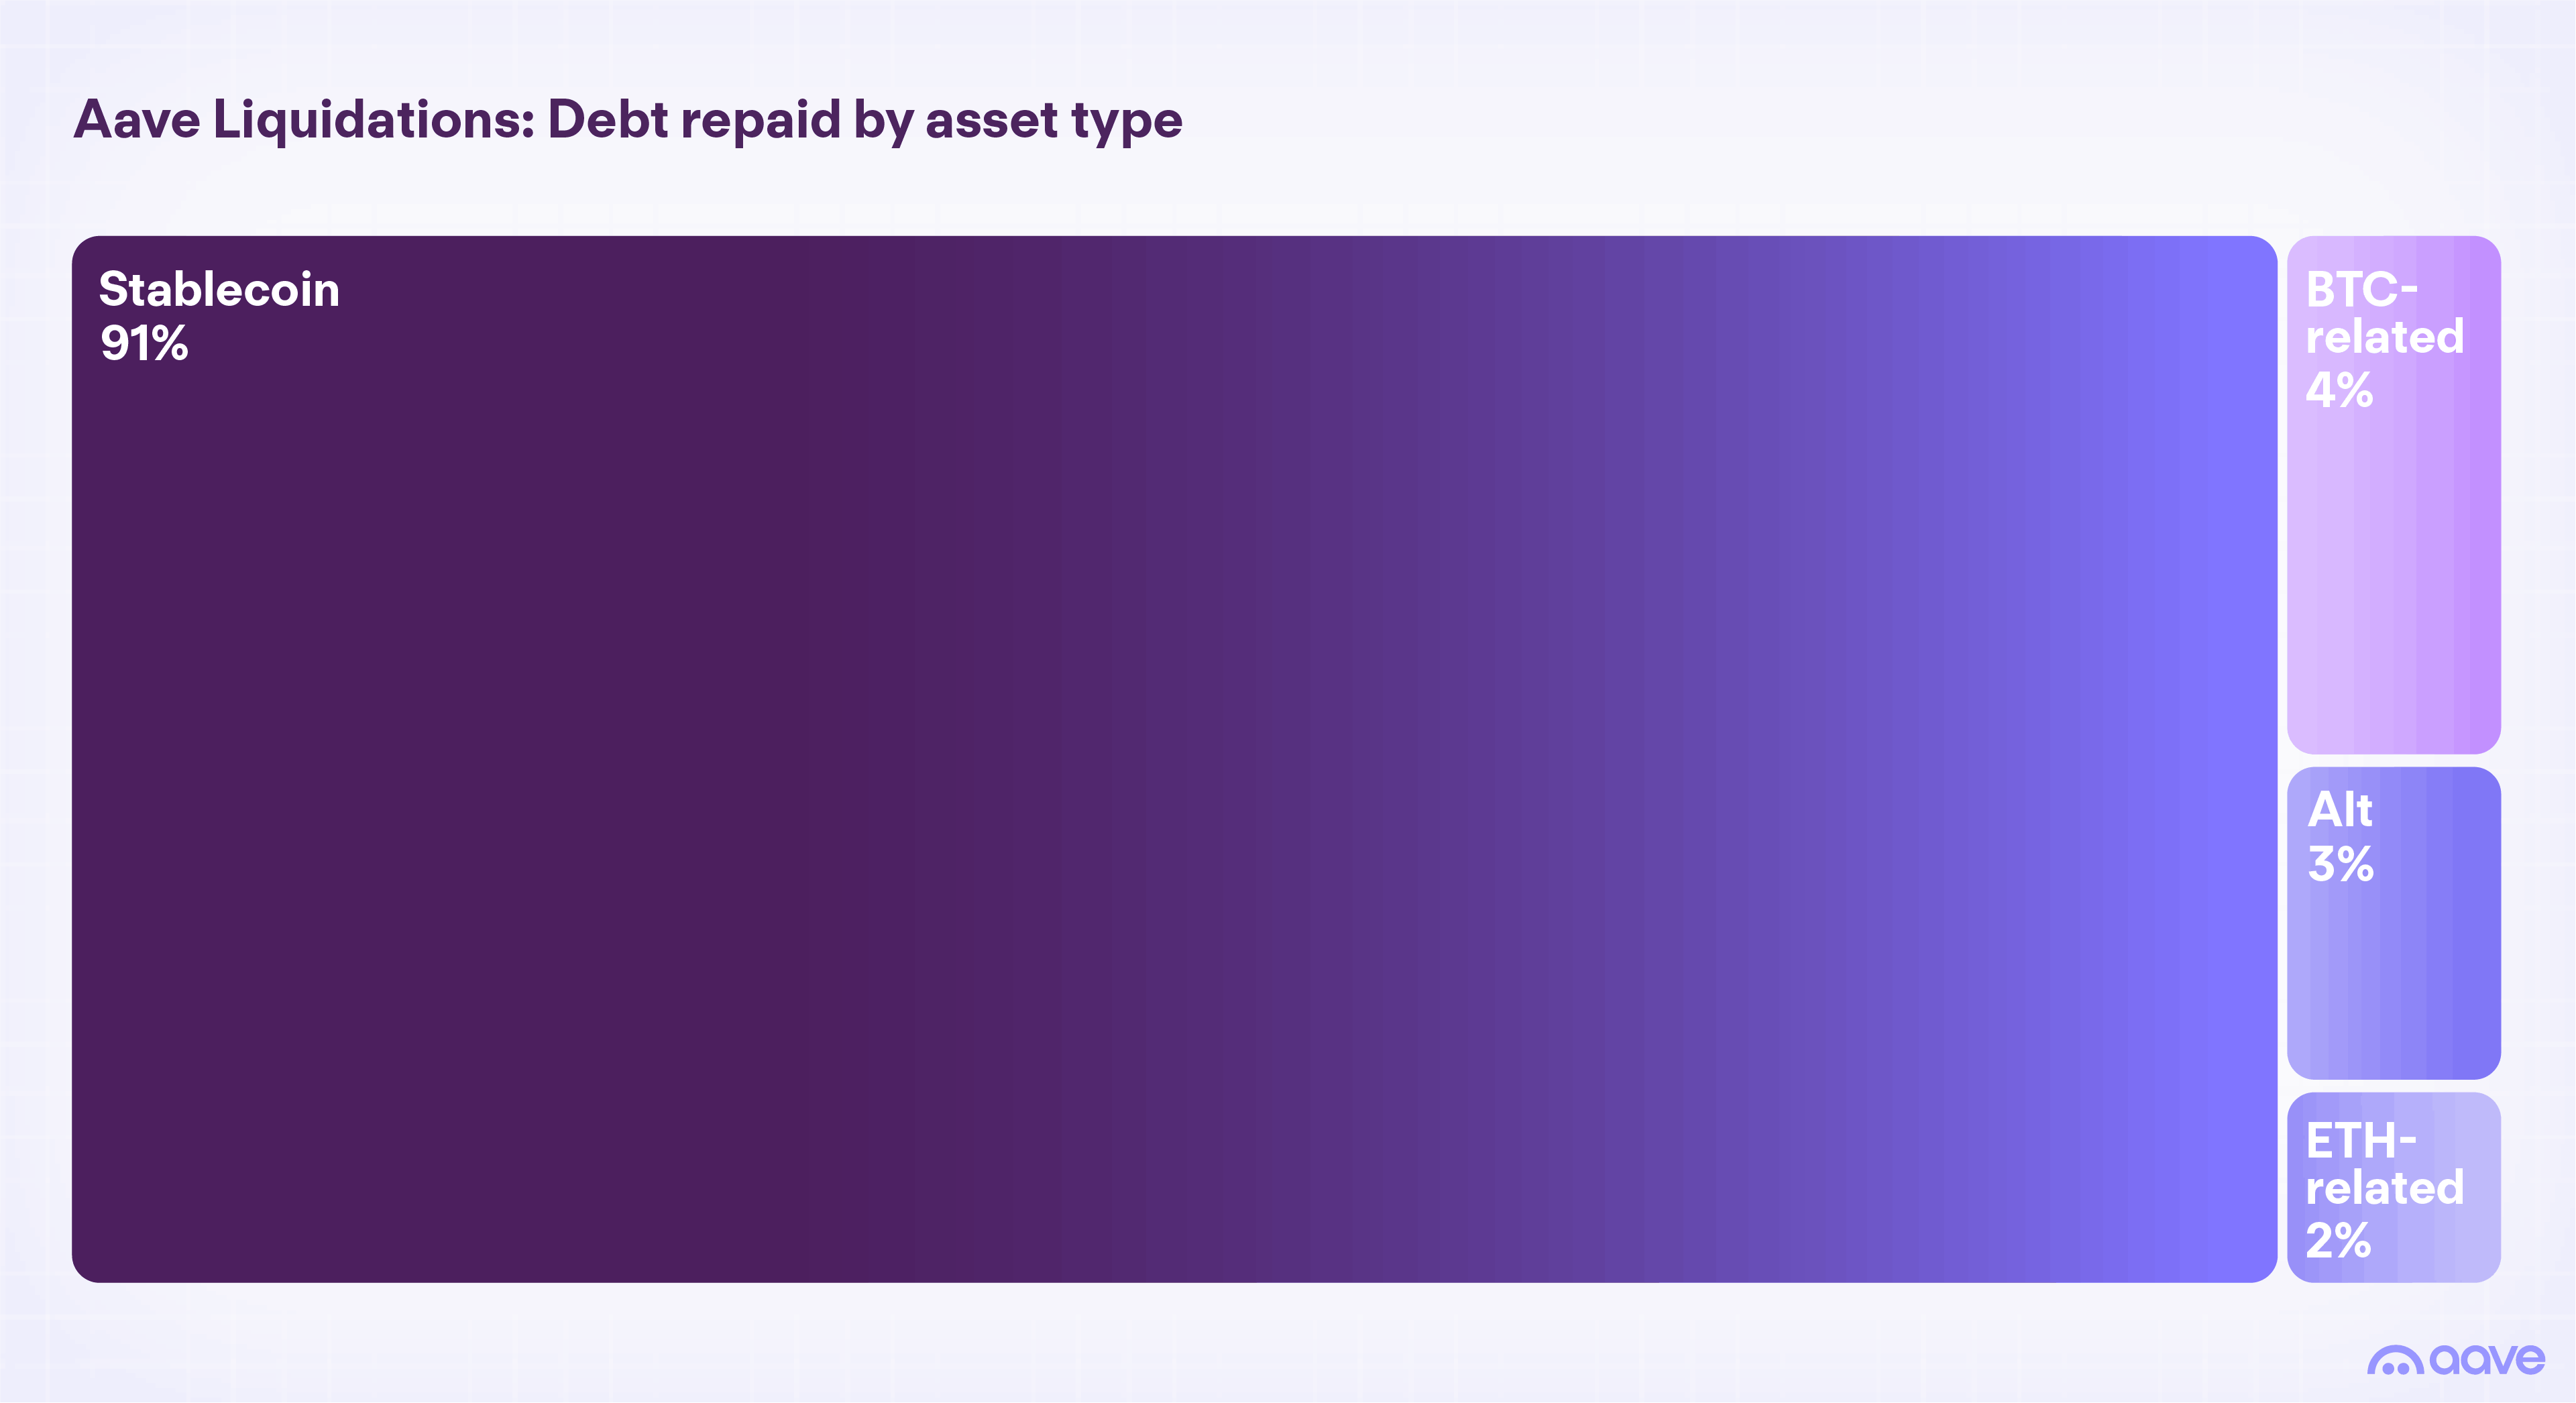
One subtle detail in the debt data: BTC-related debt repayments (4.4% of the total) run nearly three times ETH-related ones (1.6%), which the Aave researchers read as users being more willing to short BTC by borrowing it than to short ETH. If you are one of those borrowers, note that a short position's liquidation risk points the opposite direction — it is the asset rising, not falling, that ends your position.
More in Lending & Borrowing
Where you borrow changes the risk profile
Liquidation risk also varies by network, and the differences are large enough to matter. Three-quarters of Aave's liquidation volume in dollar terms — about $3 billion — occurred on Ethereum mainnet, where the average liquidation exceeds $50,000. But measured by count of events, the pattern inverts: 80% of liquidation transactions happen on non-Ethereum networks, with Polygon alone accounting for 46% of the total count — 137,187 liquidation transactions against $623 million in volume, an average in the mid-four figures.
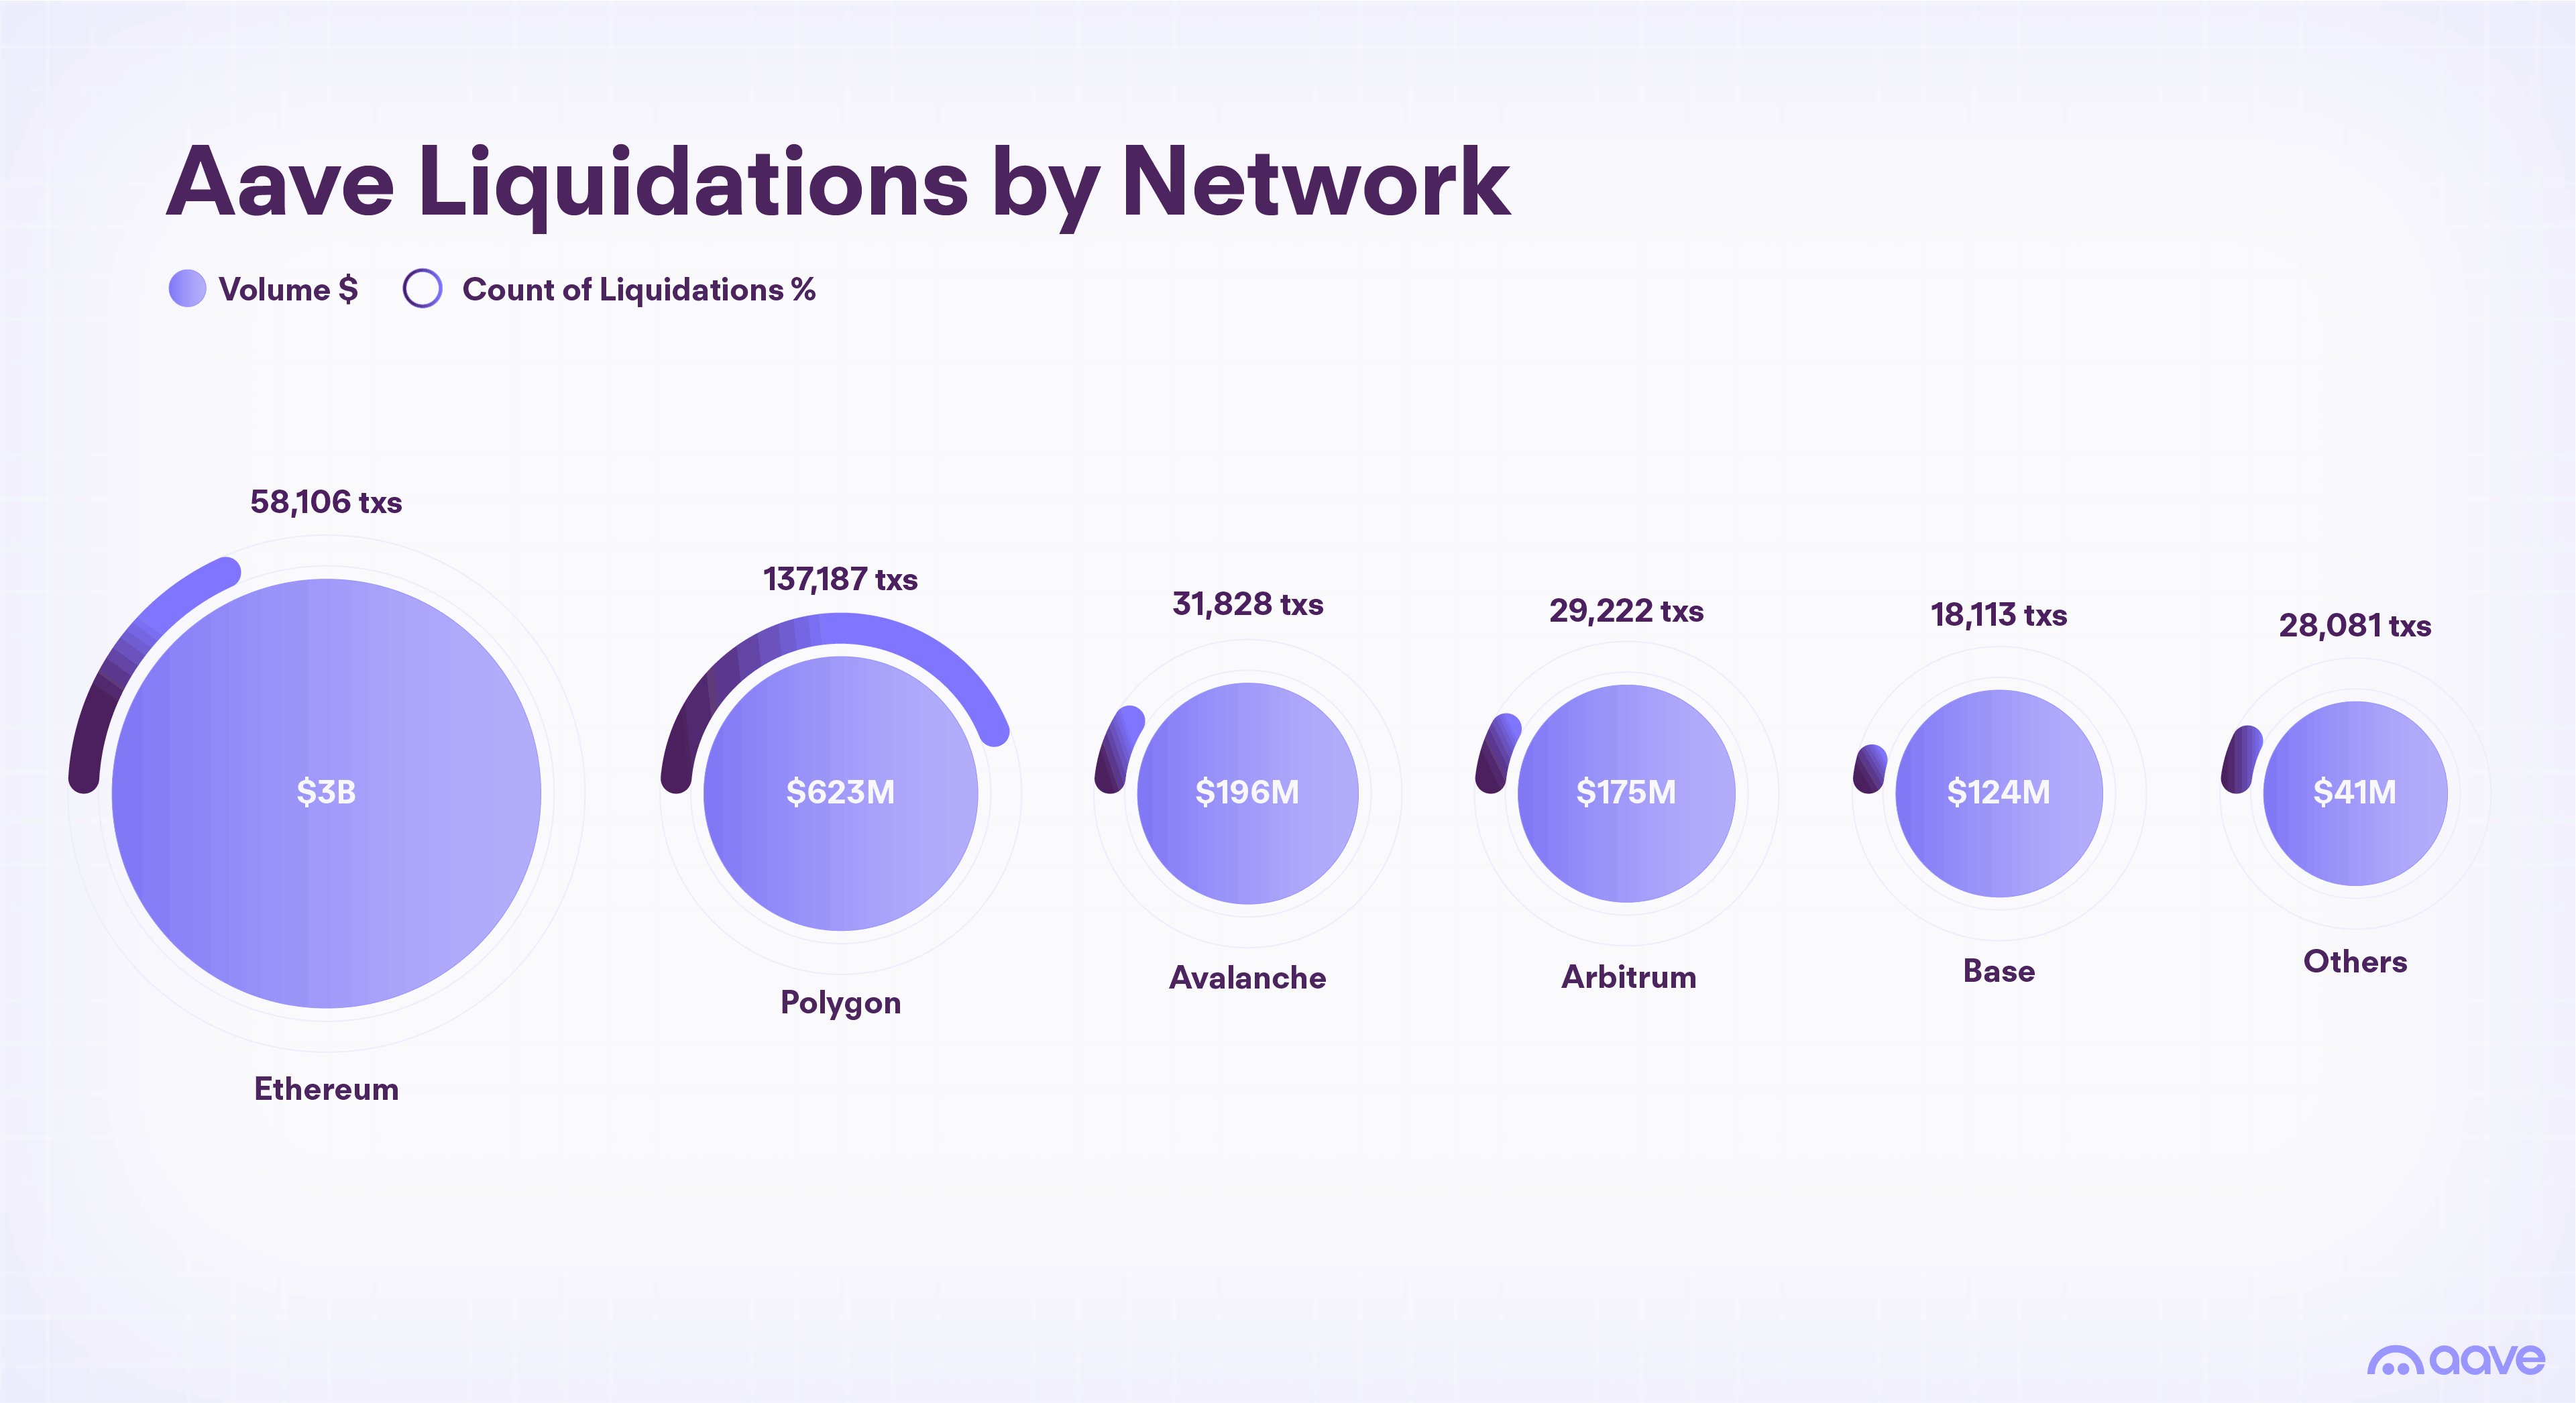
The practical readings: small positions cluster on cheap networks, and small positions get liquidated more often relative to their size. Part of that is user behavior — smaller borrowers run tighter buffers — and part is structural: on a network where a liquidation costs cents in gas, liquidators profitably close positions that would be uneconomical to touch on mainnet. A $2,000 position on Polygon has no gas-cost moat protecting it. Mainnet's high gas costs are, perversely, a small protection for small borrowers — and an argument that if your position is small enough that mainnet gas hurts, your liquidation margin needs to be wider, not narrower.
Beyond liquidation: the risks lenders carry
Everything above is borrower risk. Lenders — the depositors earning yield — face a different set, and the honest list is longer than most yield dashboards suggest.
Because no single public source compares DeFi lending's distinct loss mechanisms side by side — the liquidation data lives in Aave's research, the insolvency case studies in Curve's postmortems, and the depeg history across incident reports — we compiled one from the protocols' own published records:
| Risk | What triggers it | Who bears the loss | Documented example | Primary mitigation |
|---|---|---|---|---|
| Liquidation | Collateral price falls below threshold | Borrower (penalty + closed position) | $429M on Aave, Jan 31–Feb 5, 2026 | Low loan-to-value, major collateral |
| Bad debt / insolvency | Price falls faster than liquidators can act | Lenders, then protocol backstop | Curve's 38 underwater positions, April 2026 | Backstops, conservative listing policy |
| Smart-contract exploit | Bug in protocol code | Lenders (deposited funds) | Numerous industry-wide since 2020 | Audits, age of code, bug bounties |
| Oracle failure | Bad price feed triggers wrong liquidations | Borrowers or lenders, direction-dependent | Historically clustered on thin-liquidity assets | Robust oracle design, liquid markets |
| Stablecoin depeg | Borrowed or collateral stable loses peg | Direction-dependent | crvUSD peg stress, tracked publicly | Diversified stables, peg monitoring |
| Utilization crunch | Withdrawals exceed idle liquidity | Lenders (temporarily locked) | $1.7B withdrawal wave, Oct 10, 2025 | Rate curves that reward waiting |
The bad-debt row deserves expansion, because it is the risk lenders most consistently underprice. Liquidation only protects lenders when it completes profitably — when the collateral can be sold for more than the debt. In a fast enough crash, or an exploit, positions go underwater before liquidators act, and the loss lands on the lending pool. What separates protocols is not whether this can happen but how they respond when it does.
Curve's 2026 disclosure is the reference example of the response done well. After an incident left 38 positions unprofitable to liquidate, the team published a full solvency analysis and stood up a public recovery pool rather than quietly socializing the loss:
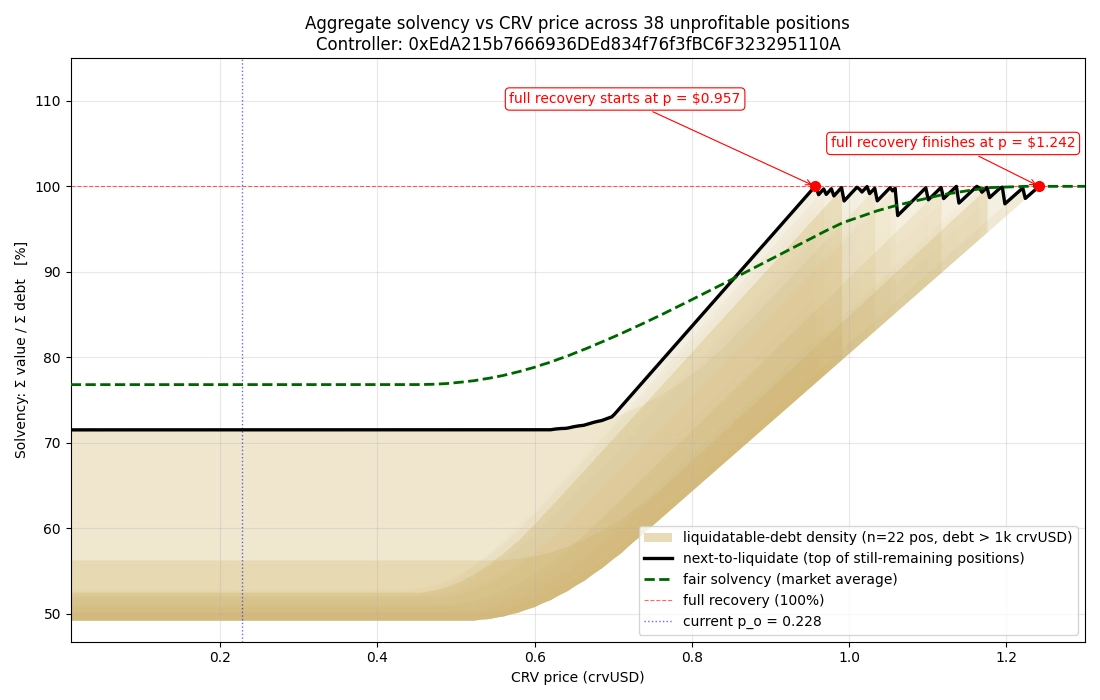
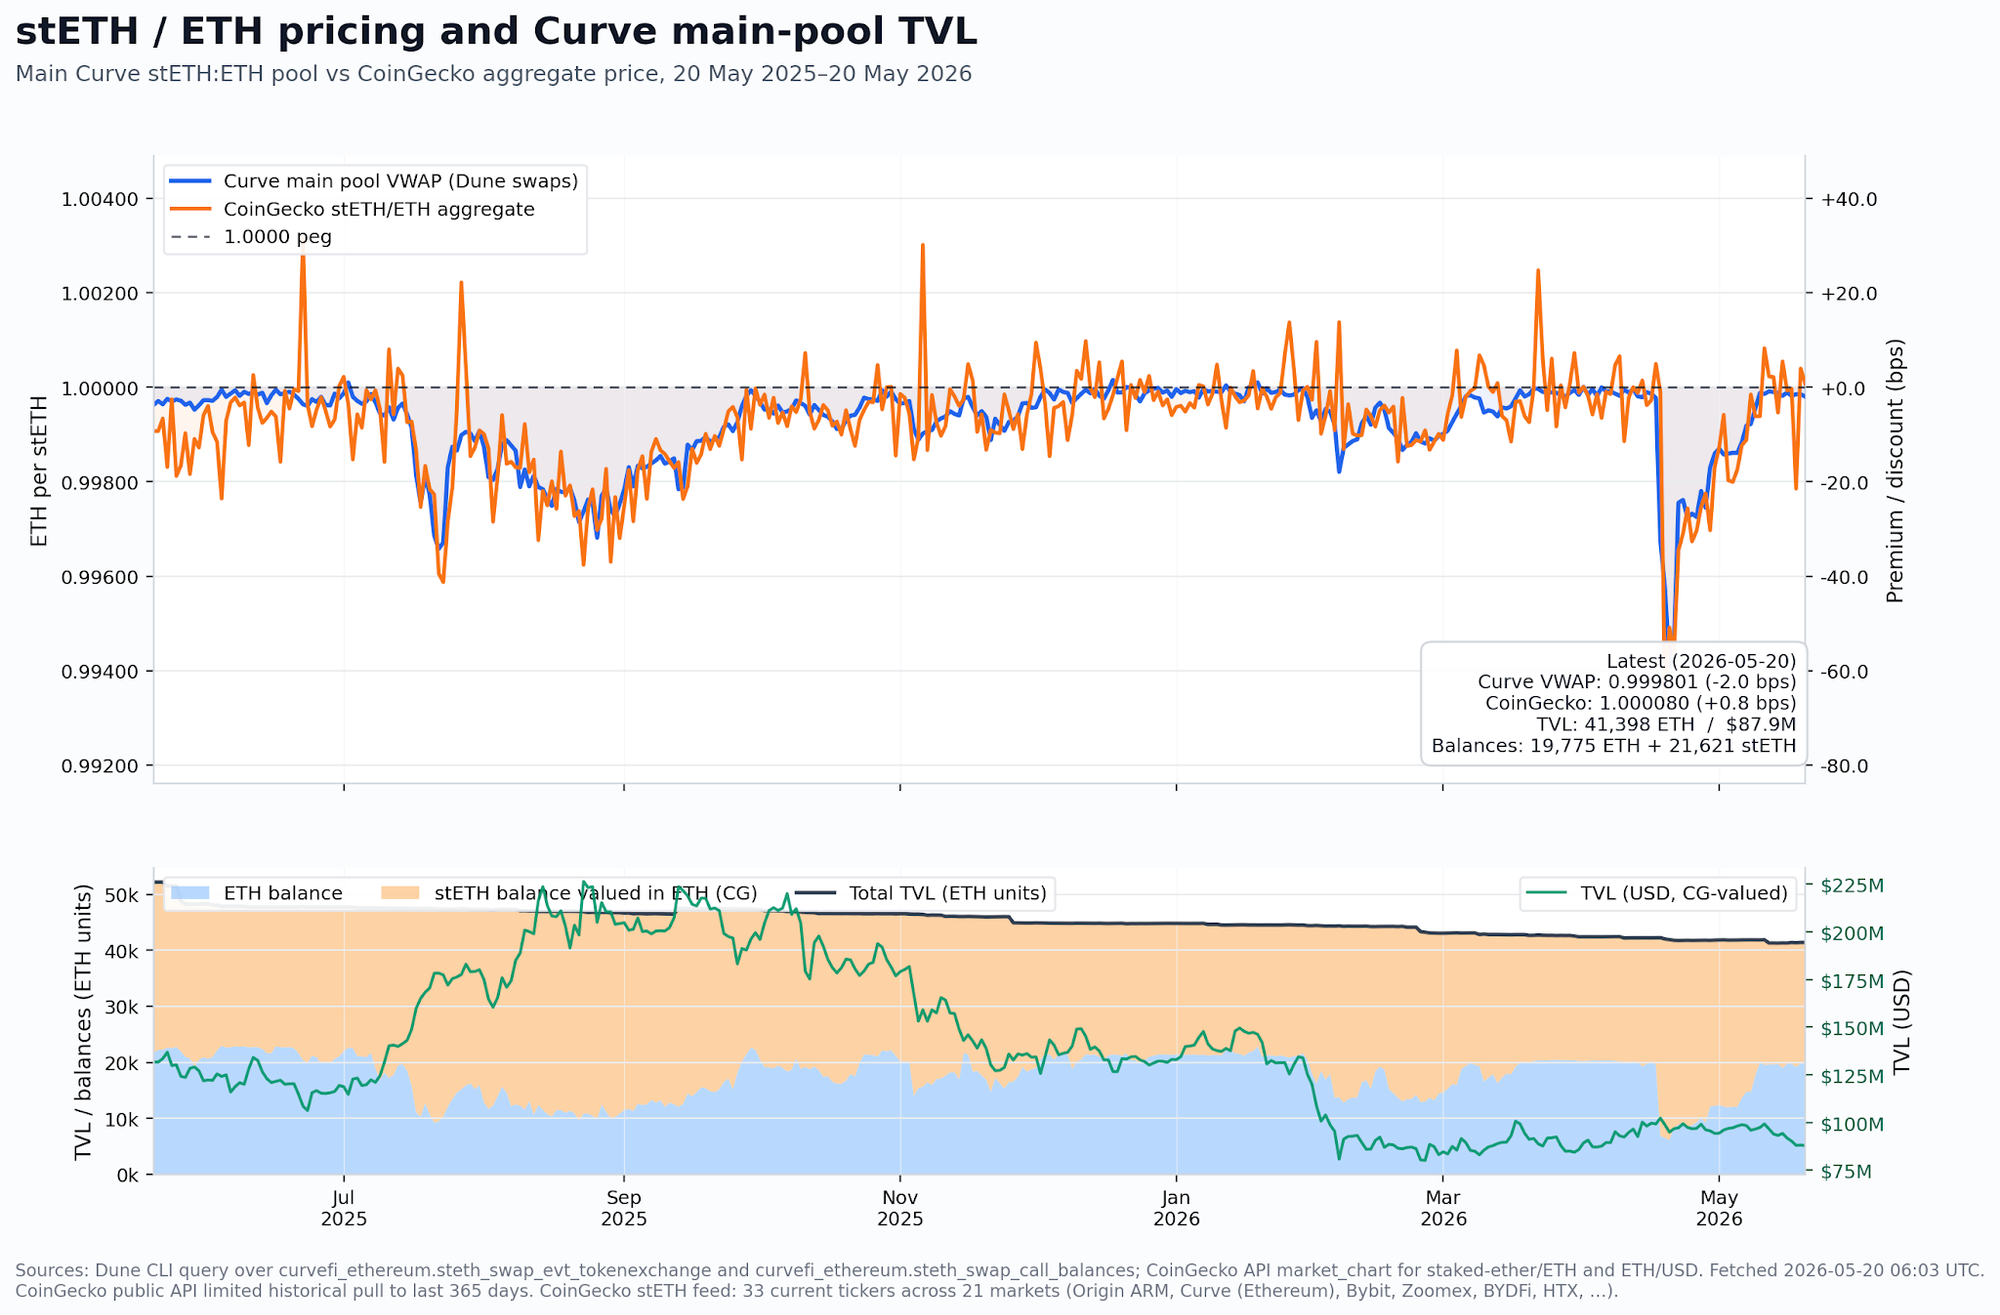
That chart is what accountability looks like in this industry: the protocol told lenders exactly how far underwater the book was and exactly what price level would restore it. When you evaluate a lending protocol, the existence — or absence — of this kind of disclosure history is a better signal than any audit badge. Our DeFi protocol safety guide treats incident-response history as a first-class evaluation criterion for precisely this reason.
The risk machinery is improving — measurably
The risk picture is not static, and it is worth crediting the mechanisms that have made recent crashes less damaging per dollar at risk than 2021's. The Aave study documents several: liquidations have become more distributed across positions (many small events rather than a few catastrophic ones), risk managers now tune collateral parameters continuously, and capitalized backstops stand behind the pools.
The most concrete recent improvement is Chainlink SVR — Smart Value Recapture — which Aave integrated in March 2025. Liquidations generate MEV (the profit opportunity of executing them), and historically that value leaked entirely to block builders and searchers. SVR lets the protocol auction the right to back-run its own liquidations and recapture most of that value.
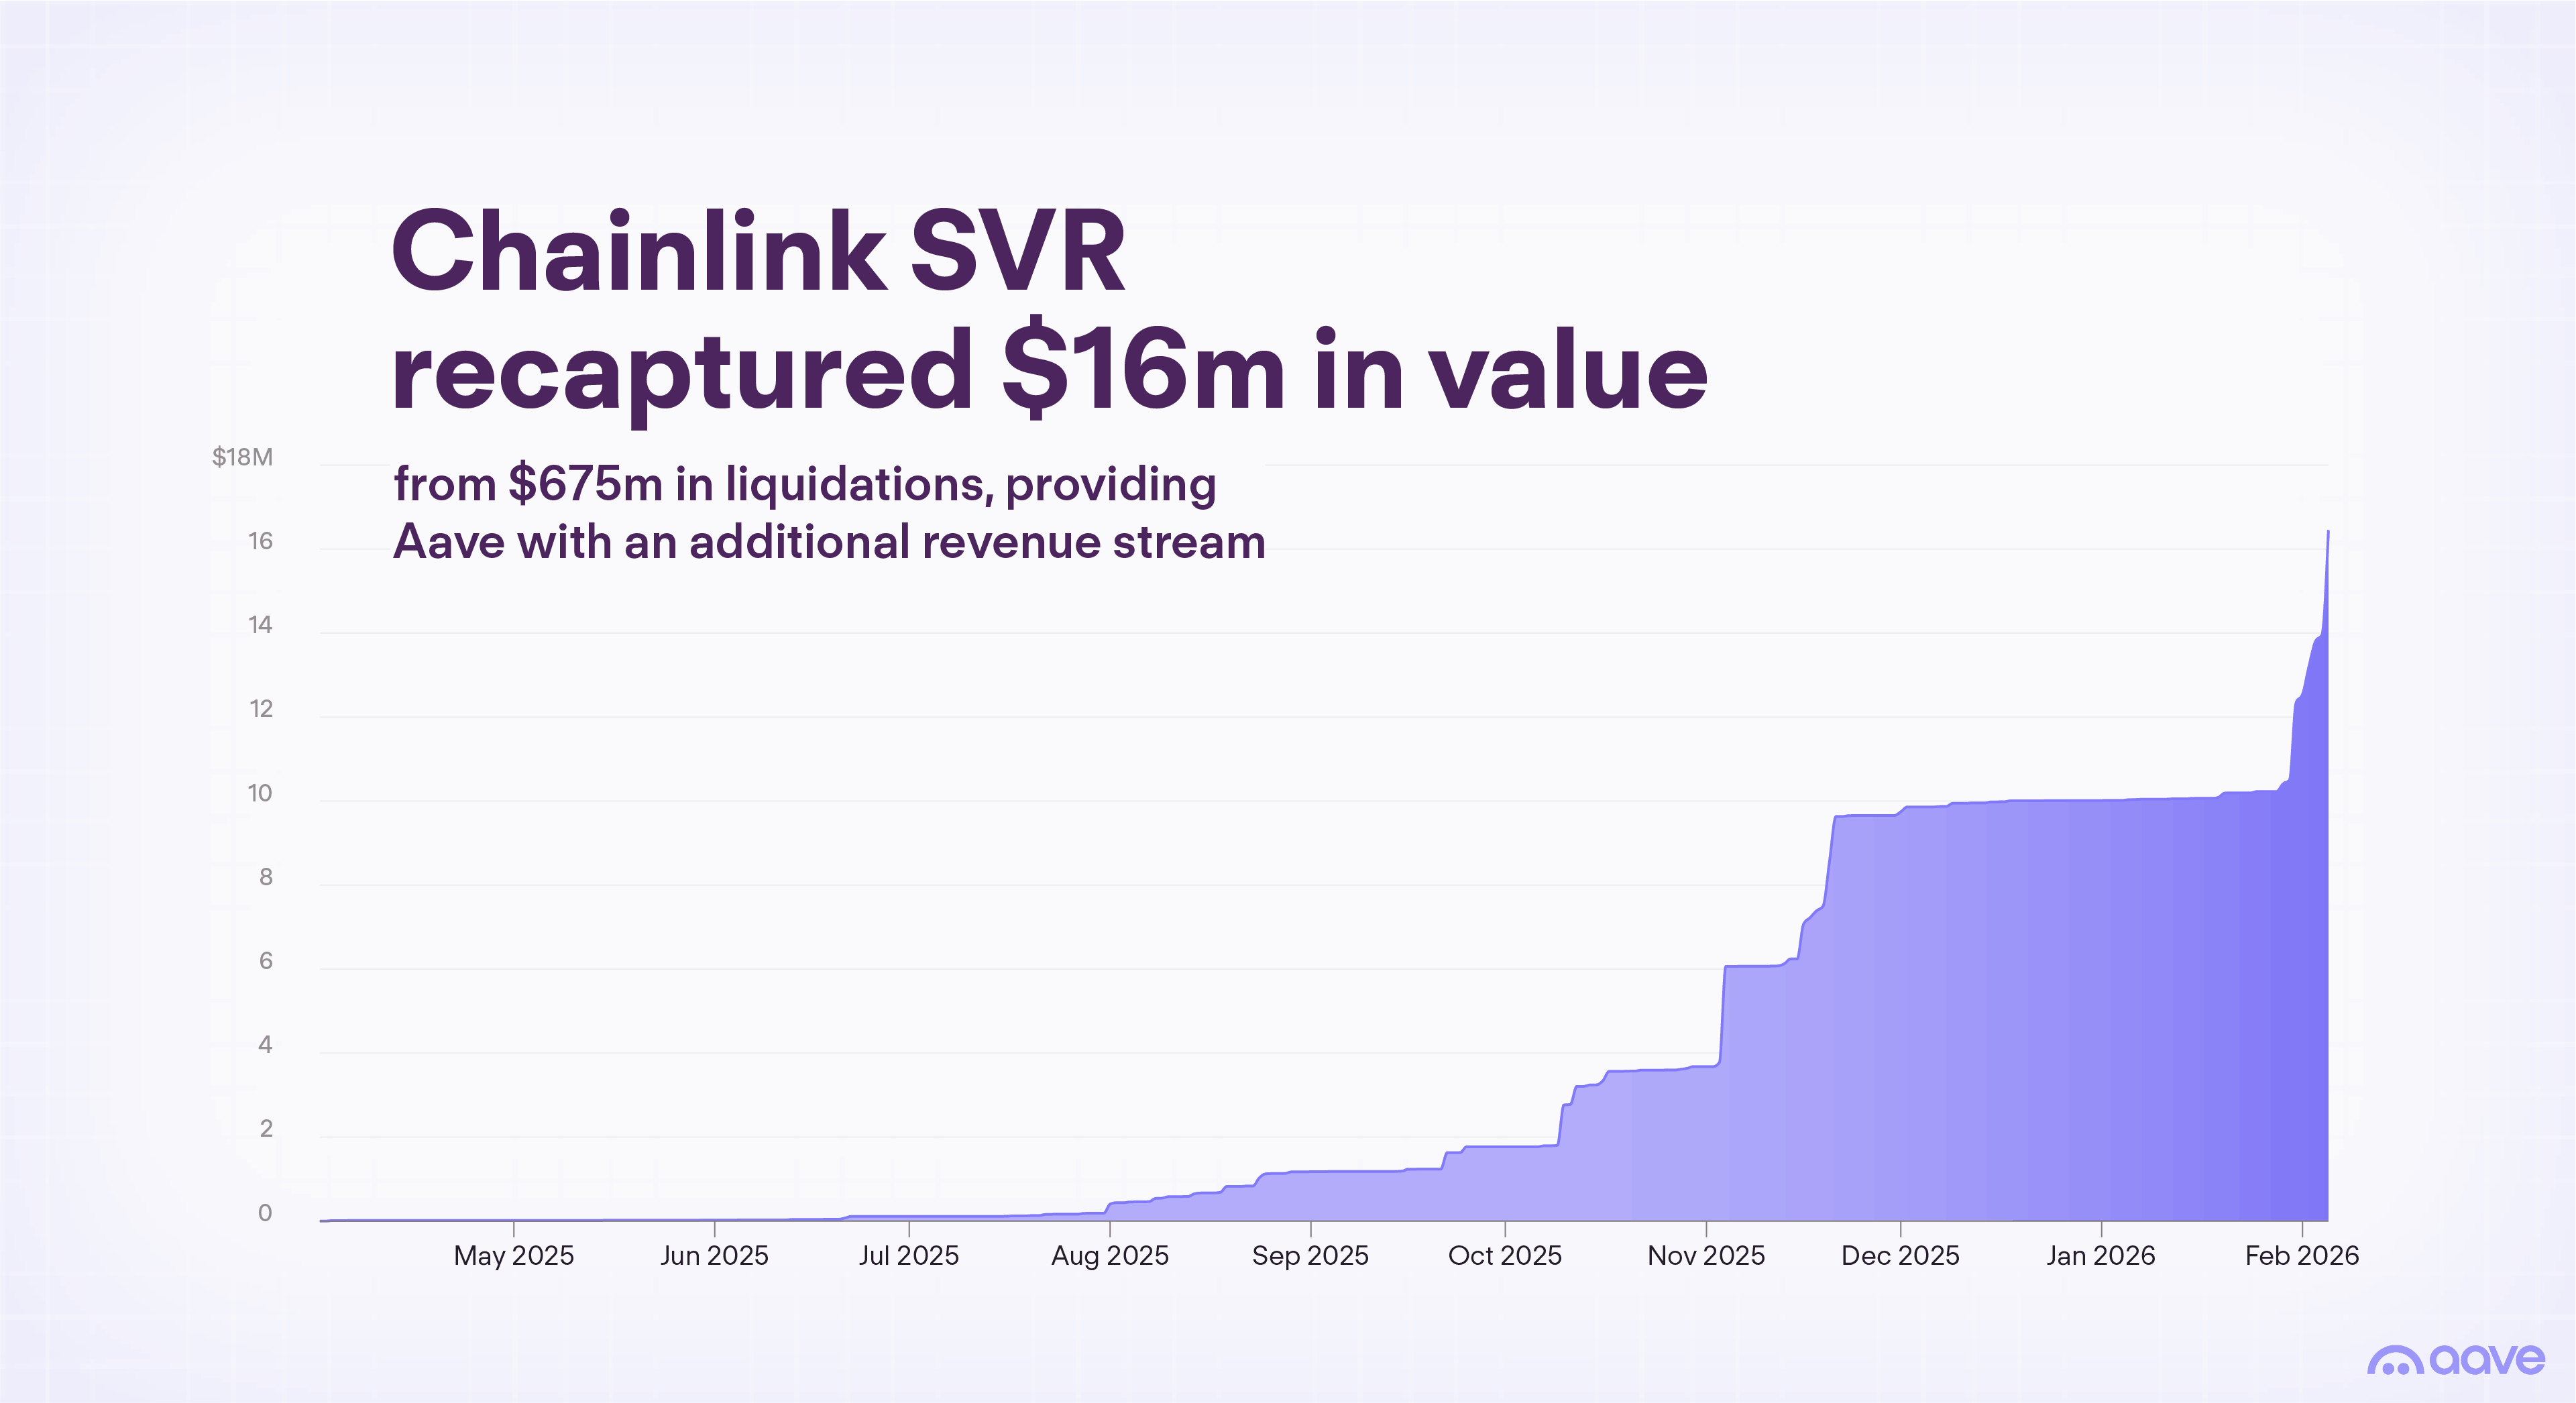
In its first nine months, SVR handled $675 million in liquidations across roughly 3,900 events and recaptured about $16 million — a 73% capture rate on the recoverable MEV, split 65/35 between the Aave DAO and Chainlink. For borrowers and lenders the direct benefit is indirect but real: value that used to subsidize external extractors now funds the protocol's own reserves, which are the backstop that absorbs bad debt before depositors do.
"We are a long-term holder who wants liquidity without selling." Borrow stablecoins against ETH or BTC at conservative loan-to-value — 25–35%, not the 70–80% ceiling protocols permit. Every major liquidation event in the historical record involved a move of 40% or less over a week; sizing to survive a 50% drawdown has, so far, meant surviving everything. Set alerts at two price levels above your liquidation point, and know in advance which asset you will deposit if the first alert fires.
"We are a yield-focused depositor comparing lending rates." Read the protocol's incident history before its APY. A protocol that has published honest postmortems and carries a funded backstop is structurally safer than a younger fork offering two points more yield with neither. Diversify across protocols rather than chasing the single best rate, and treat rate spikes as a signal — high utilization means high withdrawal-crunch risk at exactly the moments you might want out.
"We are a DAO treasury managing pooled funds." Your obligations run deeper than a retail user's: document the risk framework, cap exposure per protocol and per collateral type, and prefer venues whose liquidation performance under stress is publicly measurable. The Aave dataset exists precisely so that allocators can verify resilience claims instead of taking them on faith; demand the same from every venue you use. Staked-asset collateral adds a second protocol layer to the analysis — our liquid staking protocols guide covers how to assess that layer.
Common mistakes that turn risk into loss
- Borrowing at the maximum allowed loan-to-value. The protocol's ceiling is the point where liquidation begins, not a recommendation. Every basis point of headroom you give up is reaction time you no longer have during a 20% overnight move.
- Treating long-tail collateral like blue-chip collateral. Alt assets are 15% of liquidated collateral value despite a much smaller deposit share. Same loan-to-value, materially worse odds.
- Judging lender safety by APY and audit count. Audits are table stakes that exploited protocols also had. Incident-response history, backstop capitalization, and honest bad-debt disclosure are the differentiators the marketing page will not show you.
- Assuming you can exit during the event. October 10, 2025 saw $1.7 billion in withdrawals processed — but utilization spikes during crashes can temporarily lock lenders in, and gas spikes can make small-position management uneconomical at the worst moment. Position as if the exit door narrows exactly when you want it.
Frequently asked questions
What percentage of DeFi loans get liquidated?
On Aave, roughly 3.3% of cumulative borrow transactions have ended in liquidation — about 310,000 liquidations against 9 million borrows through early February 2026. By dollar value the share is far smaller: $4.65 billion liquidated against $982 billion in all-time borrow volume, or about 0.45%. The average is misleading in one direction, though: liquidations cluster into crash weeks, so your personal probability depends overwhelmingly on your loan-to-value ratio, not the base rate.
Can lenders lose money in DeFi lending, or only borrowers?
Lenders can lose money. The main paths are smart-contract exploits, bad debt (positions that go underwater before liquidators can close them), and stablecoin depegs on the asset they deposited. Liquidation penalties fall on borrowers, but when liquidation fails to complete profitably, the shortfall lands on the lending pool. That is why backstop reserves and a protocol's bad-debt disclosure history matter more to depositors than a fraction of a percent of extra yield.
What loan-to-value ratio is safe for borrowing against crypto?
No ratio is perfectly safe, but the historical record gives a benchmark: the worst weekly drawdowns since 2021 — the China crackdown, Luna, October 2025, and the 2026 capitulation — ran 30–40% peak to trough. Borrowing at 25–35% loan-to-value against major collateral survives a repeat of any of them with margin to spare. Borrowing above 50% means an ordinary bad week can liquidate you before you react.
Are liquidations worse on cheaper networks like Polygon?
Small positions are liquidated more readily there. Polygon accounts for 46% of all Aave liquidation transactions — 137,187 events averaging in the mid-four figures — because low gas costs make even tiny positions profitable for liquidators to close. On Ethereum mainnet, gas costs create a rough floor under economically viable liquidations. If you run a small position on a cheap network, treat your buffer requirements as stricter, not looser.
Does a protocol having been exploited or carrying bad debt mean I should avoid it?
Not automatically — the response matters more than the incident. Curve's April 2026 recovery disclosure published the exact solvency position of its 38 underwater positions and funded a public recovery pool; that transparency is evidence of a team you can trust with deposits. A protocol that has never disclosed an incident may simply have never been tested — or never been honest. Judge the disclosure record, the backstop funding, and the parameter management, not the absence of history.
Sources
- Aave Labs, "How Aave Liquidations Perform Under Volatile Conditions" — protocol liquidation research, February 2026.
- Curve Finance, "Building Recovery in Public" — solvency analysis and recovery-pool disclosure, April 2026.
- Curve Finance, "Curve Monthly Recap: July 2026" — protocol operations and lending-market update, August 2026.